Set up alerting
Goal
Get paged when the network between nodes degrades, and when the monitor itself goes quiet, without writing PromQL from scratch. kconmon-ng gives you two independent layers:
- Chart-shipped rules (
prometheusRule.enabled): fourteen built-in alerts, thirteen on by default, rendered as one staticPrometheusRuleand versioned in Git with your values. - Console-managed rules (
console.alerting.enabled): rules built in the UI from typed templates or raw PromQL, stored in PostgreSQL and reconciled into a separate, console-ownedPrometheusRuleobject.
Run both, either, or neither; they never touch each other's objects. In both cases Prometheus evaluates; kconmon-ng only manages rule objects.
Enable the chart layer
One flag (it needs the Prometheus Operator's PrometheusRule CRD):
helm upgrade kconmon-ng oci://ghcr.io/esdmitrii/charts/kconmon-ng \
  --reset-then-reuse-values --set prometheusRule.enabled=true
--reset-then-reuse-values (Helm 3.14+) starts from the new chart's
defaults and applies the values you set on earlier releases on top. Plain
--reuse-values renders the new templates over the old release's complete
values, so a default added since then never arrives, and an upgrade from a
2.0.x release stops with a message naming this flag. If you keep your values
in a file, pass it with -f instead.
That ships fourteen rules: UDPLossHigh, TCPChecksFailing,
PathMTUBlackHole, ZonePathMTUBlackHole, NodeUnreachable,
NodeIsolated, PairWentSilent, DNSChecksFailing,
ExternalChecksFailing, ZoneChecksFailing, ZoneLossHigh, plus three that
watch the monitor itself: KconmonAgentsMissing, KconmonControllerDown and
KconmonExternalAgentDown. ZonePathMTUBlackHole stays silent wherever
Prometheus holds per-pair path MTU series, so in practice it fires only
under agent.metrics.detail: zone-only or a relabeling of your own that
drops those series. KconmonExternalAgentDown ships disabled
(prometheusRule.externalAgentDown.enabled: false): its up{job} series only
exists once you scrape external agents,
so switch it on together with that job. Every expression, and the reasoning
behind the awkward ones, is in the
default alerting rules reference.
Enable the Console layer
The Console layer needs the console, a database and the same CRD:
database:
  existingSecret: kconmon-db-app # Secret holding a postgres:// DSN
console:
  enabled: true
  alerting:
    enabled: true # renders a namespaced Role: list prometheusrules, get/create/patch/delete on bundleName only
Then build rules on the Alerting page. Creating and
editing them needs the alerts:manage permission, which the built-in
operator, alert-editor and admin roles hold (alert-editor exists for
exactly this: alerting authority without the operator's fleet-config
authority). The builder offers six typed templates, each taking operator
units like percent and rendering the ratio math for you:
pair-loss: packet loss between nodeszone-latency: cross-zone latency quantiledns-failures: DNS failure sharehttp-ttfb: HTTP time-to-first-byteagent-missing: registered agents below expectedexternal-target-down: external target failing
plus raw for hand-written PromQL. The preview panel runs the expression
against your Prometheus right now and reports how many series it matches,
zero named as an answer rather than a failure.
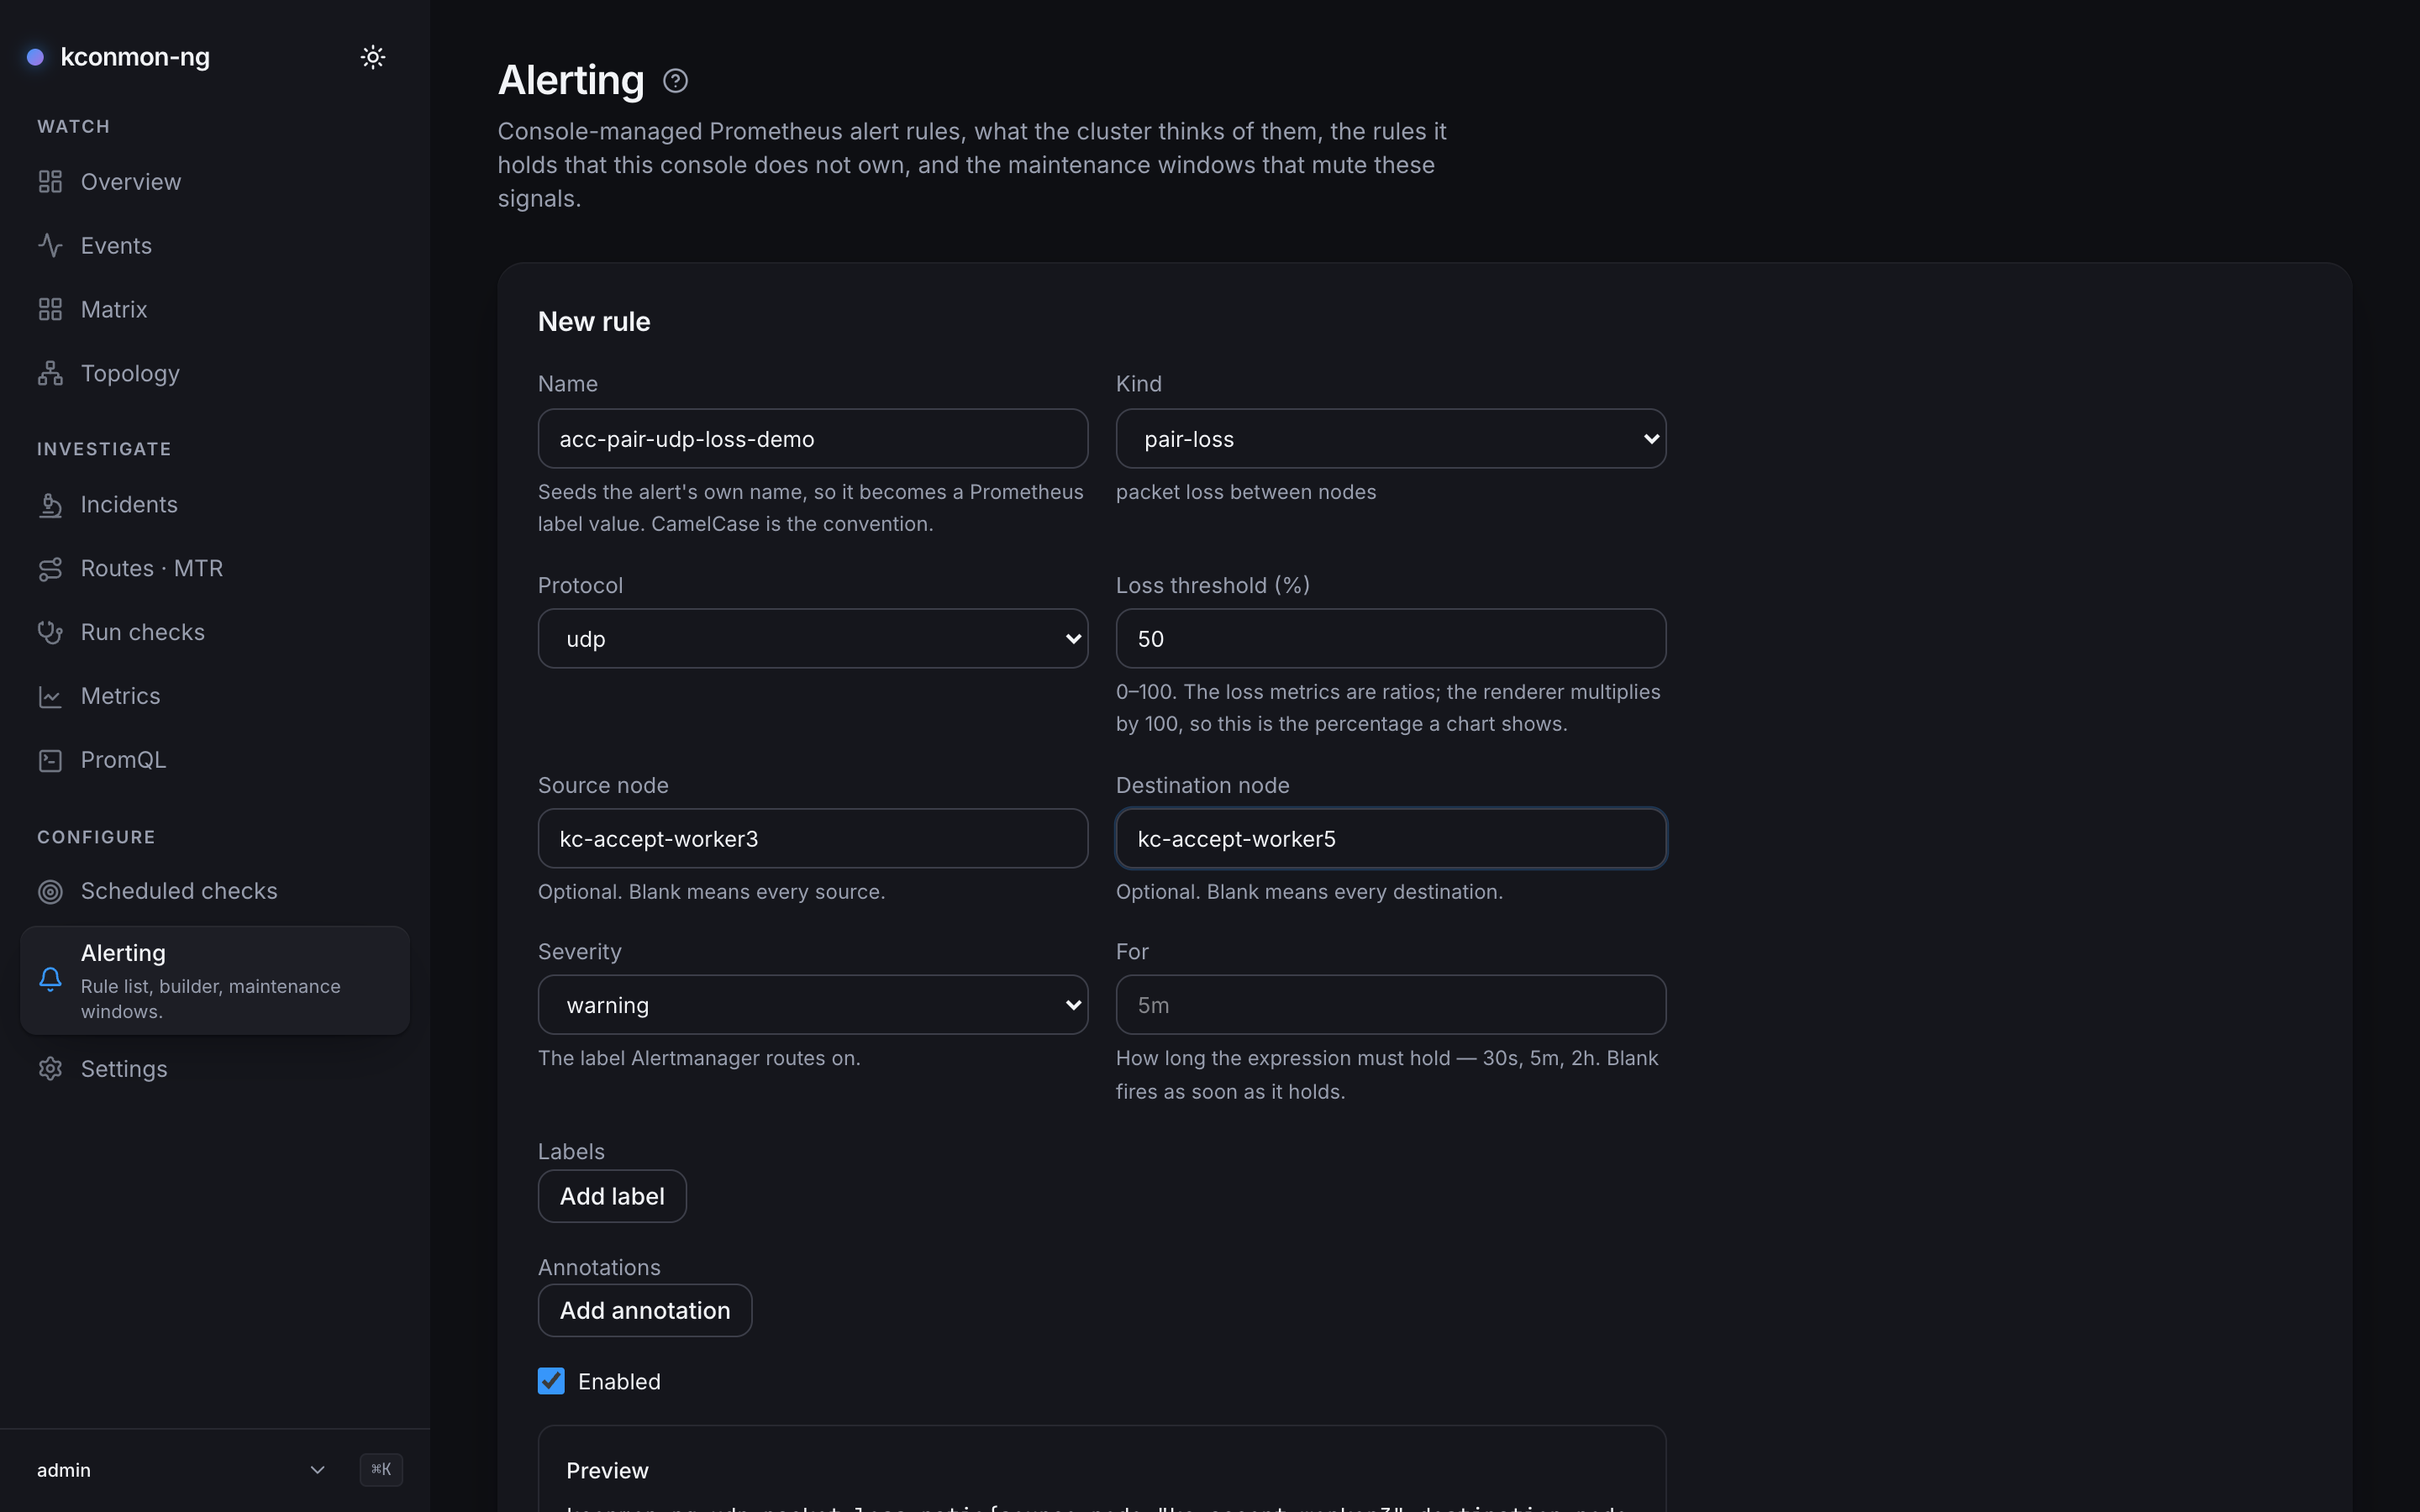
for left at its 5m placeholder.One caveat that looks like a bug and is not: your Prometheus must select
the object the console writes. A stack that scopes ruleSelector by label
will show the rule as synced and never fire it until you widen the
selector.
Tune thresholds
Every built-in rule takes enabled / threshold / for / severity
(thresholds are ratios in 0.0–1.0):
prometheusRule:
  enabled: true
  udpLossHigh:
    threshold: 0.25 # page earlier on UDP loss
    severity: critical
  externalChecksFailing:
    enabled: false # not running external checks
  additionalRules: [] # your own rules, appended verbatim
Disabling one removes exactly that rule and nothing else. Before retuning,
know what the defaults already protect you from. The failure-ratio rules
compare rate(fail)/rate(all), at 5% in-cluster and 10% for external
targets, rather than rate(fail) > 0, so one flaky probe in a healthy stream does not
page anyone. PairWentSilent fires on absence that lasts 5 minutes plus
its prometheusRule.pairWentSilent.for (10m by default, so about 15 minutes):
silence has to outlast a rollout or a drain. Console-managed rules are tuned in the UI
instead; each rule's threshold, hold and severity are fields on the rule.
Route notifications
Chart rules are ordinary Prometheus alerts: route them with whatever
already handles your alerting (Alertmanager, Grafana Alerting). Labels carry
the pair (source_node, destination_node, both zones), and the annotations
name the failing pair, direction and measured value, so grouping by pair
works out of the box.
The Console delivers webhooks itself, off Prometheus's alert state, with
no Alertmanager involved. Configure an encryption key first. It seals the
per-endpoint signing secrets at rest (AES-256-GCM), and without it endpoint
creation and testing answer 503, naming webhooks.encryptionKeyFile (console
config) and console.webhooks.existingSecret (Helm, base64 of 32 random
bytes):
With networkPolicy.enabled, a receiver running as a pod in the cluster also
needs a selector peer on its pod port (the Service's targetPort) in
console.networkPolicy.webhookEgress, on every CNI; the default rule is an
ipBlock meant for receivers outside the cluster. On Calico and Antrea that
ipBlock also matches every pod on 80 and 443 unless
networkPolicy.clusterCIDRs carves the cluster out. See
NetworkPolicy on Cilium, Calico and Antrea.
Then add endpoints under Settings → Webhooks (this needs webhooks:manage,
which only the admin role holds: an endpoint URL plus a signing secret is
credential material). Each endpoint subscribes to events from a closed
vocabulary: alert.fired, alert.resolved, incident.created,
incident.resolved, incident.reopened. An open maintenance window holds
back alert.fired and alert.resolved for every alert its scope covers
(how the hold works); it does not touch
what Alertmanager delivers for the chart's rules.
Will I get paged twice?
Only if you wire it that way. The two delivery paths are independent, and the
console-written PrometheusRule is an ordinary rule object to Prometheus: if
your Alertmanager's routes match its alerts, Alertmanager delivers them and
the console's webhook watcher delivers them. One alert, two pages. Every
managed rule carries two reserved labels, severity and
kconmon_ng_rule_id, precisely so you can decide. Route or silence on
kconmon_ng_rule_id in Alertmanager when the console webhook should own
delivery, or simply do not subscribe an endpoint to the alert events when
Alertmanager should. The reverse overlap does not exist: the watcher fires
only for alerts carrying kconmon_ng_rule_id, so the chart's bundled rules
never arrive through console webhooks; an unmanaged firing alert belongs to
whoever owns that rule.
The payload on the wire
Alert-family deliveries (alert.fired / alert.resolved) carry this body:
| Field | Meaning |
|---|---|
event |
alert.fired or alert.resolved |
sentAt |
when this delivery was built; marshalled once, so stable across retries, but not across replicas |
alert.ruleId |
the console rule's id, off the kconmon_ng_rule_id label; never empty |
alert.ruleName |
the alert's name as Prometheus knows it (the sanitized alertname) |
alert.severity |
the rule's severity |
alert.expr |
the rendered PromQL; "" if the row could not be resolved |
alert.labels |
Prometheus's label set for this alert instance, verbatim; includes alertname, severity, kconmon_ng_rule_id; never null |
alert.annotations |
the alert's annotations, verbatim; never null |
alert.firedAt |
Prometheus's activeAt: when the expression started matching, not when the console noticed; stable across replicas |
alert.resolvedAt |
null on alert.fired, set on alert.resolved |
Shaped like this (values illustrative):
{
  "event": "alert.fired",
  "sentAt": "2026-08-30T10:15:02Z",
  "alert": {
    "ruleId": "3f2a…",
    "ruleName": "M02M03UdpLoss",
    "severity": "warning",
    "expr": "kconmon_ng_udp_packet_loss_ratio{…} > 0.5",
    "labels": { "alertname": "M02M03UdpLoss", "severity": "warning", "kconmon_ng_rule_id": "3f2a…" },
    "annotations": { "summary": "…" },
    "firedAt": "2026-08-30T10:14:31Z",
    "resolvedAt": null
  }
}
Incident-family deliveries carry {event, incident, at} instead, where
incident is {id, title, scope, status, fromAt, toAt, createdBy}; notes
and pinned findings are left out of the wire body on purpose. A Test ping
uses event: "test" with a synthetic incident in the same envelope, so your
receiver needs one parser, not two.
Dedupe on (event, ruleId, labels, firedAt). With
console.replicas > 1 every replica delivers (there is no leader election
on the watcher), so two replicas means two copies of each edge, and that
tuple is stable across them precisely so a receiver can collapse the copies.
Verify the signature
Every delivery carries X-Kconmon-Signature: sha256=<hex>: an HMAC-SHA256
over the exact raw body bytes, keyed with the endpoint's signing secret.
Verify against the bytes you received, before parsing:
The secret is yours: you supply it when creating the endpoint (required,
since every delivery is signed), and it is write-only thereafter. No API
response ever returns it; an update that omits the secret field keeps the
stored one, so "retrieve the secret" is not an operation that exists. Store
it in your receiver at creation time. At rest it lives encrypted under the
console-webhooks-encryption-key from the values above.
How delivery behaves
- Retries climb a fixed ladder: immediately, then ~30s, then ~5m, each
non-zero rung jittered ±20%. A delivery reaches exactly one terminal
outcome: succeed on the third attempt and it counts as one
ok, not two failures and a success (kconmon_ng_console_webhook_deliveries_totalcounts deliveries, never attempts). resolvedAtis only as precise asconsole.webhooks.alertPollInterval(30s by default). A resolution is detected by the alert's absence from a poll, so the timestamp means "somewhere in the interval ending here".- The Test button is one shot, on purpose. An operator clicking it is asking a question and waiting for the answer on the endpoint row; a test that silently retried for five minutes would answer a different question.
Test the path
Test on a webhook endpoint answers "can I reach you": it sends the probe-shaped payload described above and records the outcome verbatim on the row.
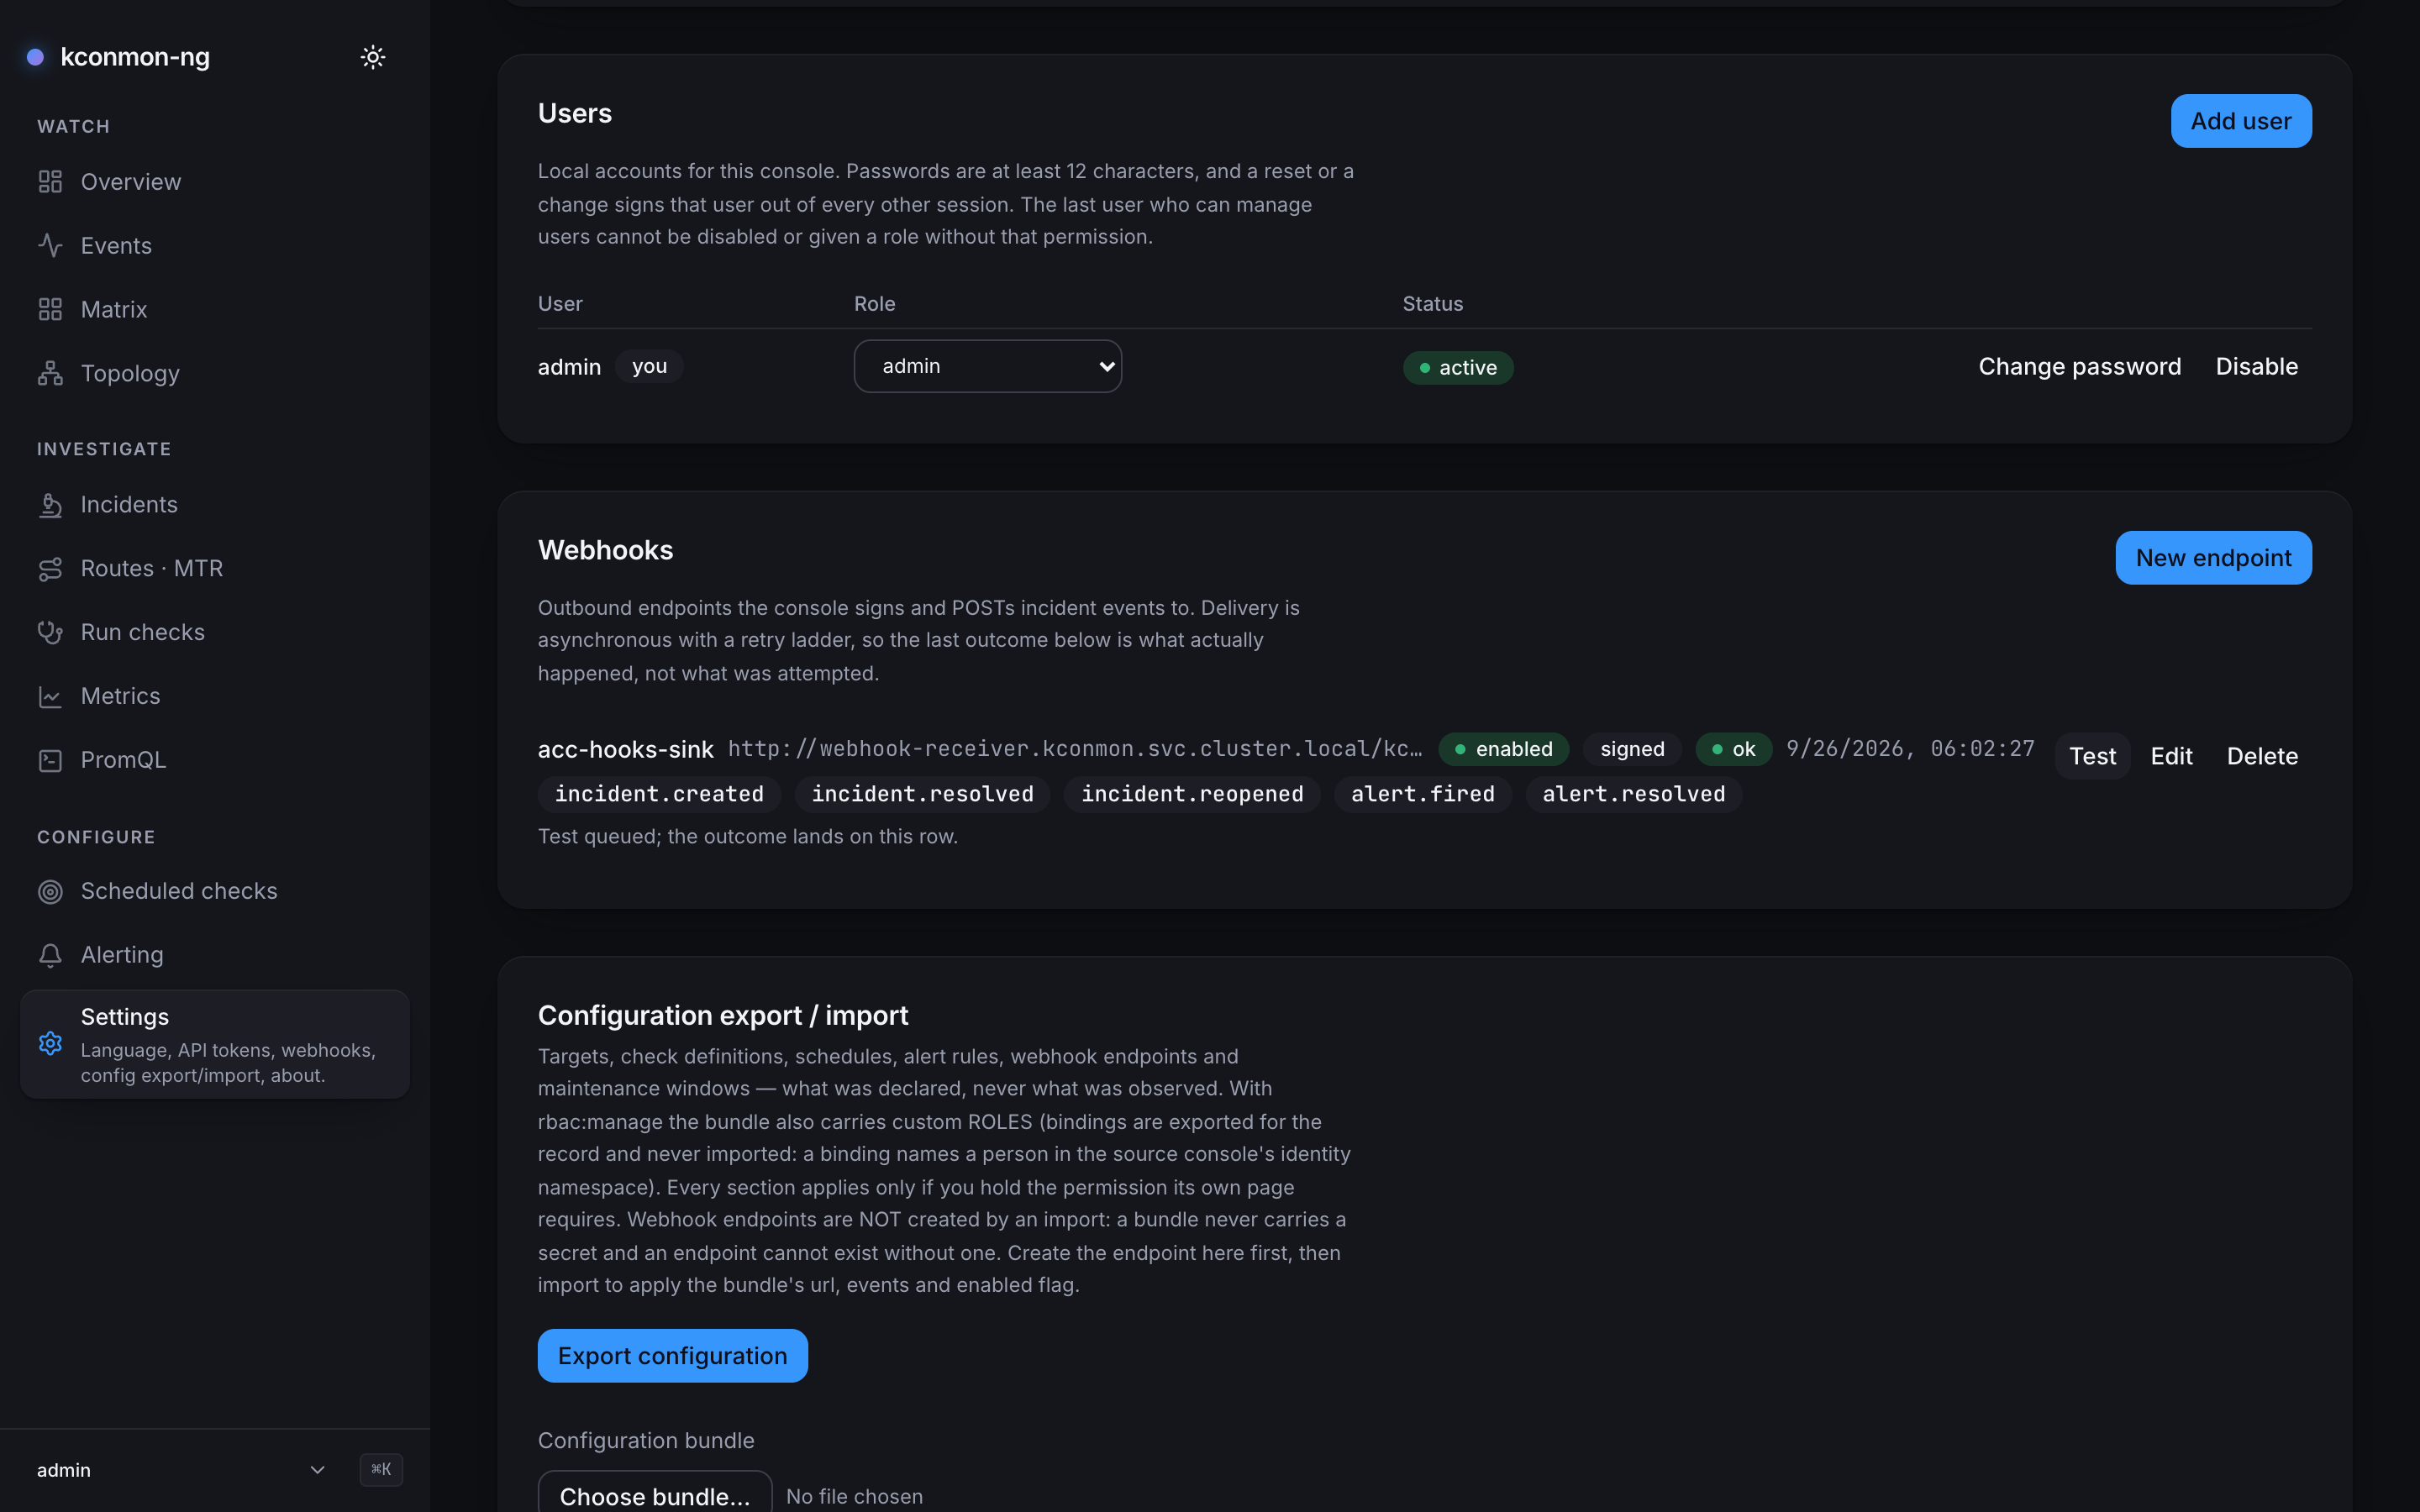
To test the whole path (rule, Prometheus, delivery), break something real on
a disposable stand. The demo blackholes UDP
between two nodes of a kind cluster, watches UDPLossHigh go pending within
half a minute, declares a console rule scoped to that pair with for left
blank, and points a signed webhook endpoint at it. Better to learn your paging
path works from that than from a real incident.