External agents
kconmon-ng measures node-to-node connectivity, and not every node worth measuring is a Kubernetes node. A bare-metal machine, a VM in another network, the far end of a VPN. Install the agent there and it joins the same mesh as the in-cluster DaemonSet: the same Linux binary, the same checkers, the same metrics, one matrix with every vantage point on it.
What differs is trust and delivery. In-cluster agents dial the controller's plaintext gRPC port, which is safe only because that port is never exposed (and the optional NetworkPolicy pins it further). An external agent gets neither guard, so it connects to a separate TLS gateway on the controller and authenticates with a bootstrap token, optionally proving which agent it is with a client certificate. The in-cluster listener is untouched by all of this; exposing it directly remains the thing not to do (see Architecture).
Before you start: versions and NetworkPolicy
Two prerequisites bite before any of the configuration below does.
Keep the images at least as new as the chart
The gateway shipped in kconmon-ng v2.3.0: the controller understands the
externalGateway config key from that release on, and the agent knows
agent.tls and agent.bootstrapTokenFile from the same one. The chart
emits the gateway key only when the gateway is enabled, because a
controller image that predates it rejects the unknown key and
crashloops. A default install pins matching images; if yours pins the
controller image behind the chart, roll the image first and flip
controller.externalGateway.enabled second. The same skew logic applies
on the host: an agent binary older than the gateway does not know the TLS
keys either, so install a current package there.
With networkPolicy.enabled, there is a second, quieter trap. The chart's
agent policy admits probe ingress and egress only from and to this
release's agent pods, a pod-selector match. An external agent's host IP
matches no pod selector, so every external↔cluster probe is dropped by the
CNI even after the host firewall is satisfied, and
networkPolicy.externalAgentCidrs does not help on its own: that list opens
only the gateway port on the controller, registration and nothing else.
The probe half is networkPolicy.externalPeerCidrs (since 2.4.0): the CIDRs
you list there are spliced as ipBlock peers into the agent↔agent rules of
the agents' own NetworkPolicy (the controller has a separate one that
never sees this list), ingress and egress, UDP grpcPort (9090) and TCP
httpPort (8080) plus the ports-less ICMP/MTR rule (NetworkPolicy v1 cannot
name ICMP as a port), and never into the gateway rule. Set both lists.
Without externalAgentCidrs the agent cannot register; without
externalPeerCidrs it registers fine and every cell between it and the
cluster stays red.
On Cilium, a source that is a node IP matches no ipBlock: Cilium tags it
with the remote-node or host entity first. That is what the gateway sees
behind a NodePort or an externalTrafficPolicy: Cluster LoadBalancer, so
there externalAgentCidrs admits nothing. With the gateway on,
networkPolicy.ciliumKubeAPIEgress (auto on a cluster that serves
CiliumNetworkPolicy) renders <fullname>-node-ingress, which admits those
entities to the controller's gateway port and nothing else; see
NetworkPolicy on Cilium, Calico and Antrea.
A third list, networkPolicy.nodeCidrs, belongs to
agent.hostNetwork rather than to
external agents as such: host-network agents register from node IPs, and the
chart refuses to render the policy without the list. On Cilium that list
matches nothing either, and the same <fullname>-node-ingress policy admits
the nodes to the controller's grpcPort. Read that section before turning
the option on.
The trust model
The gateway is a second gRPC listener (default port 9443) serving the same services on the same registry, so an external agent is an ordinary fleet member the moment it authenticates. Three layers stack:
- TLS. The gateway serves a certificate you provide; agents verify it against a CA file or the system trust pool. TLS 1.2 is the floor.
- A bootstrap token proves fleet membership. Every RPC carries it as a
bearer credential; the controller compares in constant time and answers
Unauthenticatedto anything else. Tokens shorter than 16 characters are refused at controller startup; this is the gateway's only shared secret, and a short one turns it into an online brute-force target. - An optional client CA proves identity. When configured, every
connection must present a certificate signed by that CA, and the
certificate's CN (or a URI SAN) is pinned against the identity each
request claims: registration must claim exactly the certified node name
and an agent ID that extends it with a
-suffix (edge-host-01-…), and every later call may only speak for such agent IDs. A mismatch isPermissionDenied; a missing certificate fails the TLS handshake itself (the agent seesUnavailable).
Without the client CA the gateway runs in token-only mode: membership is authenticated, but agents cannot be told apart. See the v1 limitations before choosing it.
The token is checked per RPC, so since 2.5.0 the gateway also bounds what a client that has not proven membership can hold. None of these limits is configurable, and none touches a working agent, which authenticates with its first RPC and then holds its Watch stream:
- the TLS handshake and the HTTP/2 preface must finish within 10 seconds;
- a connection must authenticate, with a first RPC carrying a valid token, within 30 seconds of connecting, or it is closed; a failing RPC does not extend that;
- at most 128 connections may be unauthenticated at once. Past that, the new
connection is still admitted and one unauthenticated connection of the
source holding the most (an IPv4 address or an IPv6 /64, the new
connection counted) is closed. Within that source a connection still in
its TLS handshake goes before one that finished TLS, oldest first, so a
flooding source pushes out its own connections first, and bare TCP
sockets push out each other rather than an agent. The controller logs
external gateway closing the oldest unauthenticated connections: too many have not authenticated yetat WARN, at most once a minute, with the numberclosedsince the last line and thesourceof the last one; - a connection with no RPC in flight for 2 minutes is closed (gRPC keepalive
MaxConnectionIdle).
Behind a NodePort or an externalTrafficPolicy: Cluster LoadBalancer every
client arrives from a node IP, so the gateway sees only a few sources. A
client there can still push an agent's connection out, by opening more than
128 connections from the agent's source while the agent is in its TLS
handshake, or by completing more than 128 TLS handshakes before the agent's
first RPC; the agent then reconnects. loadBalancerSourceRanges, or
externalTrafficPolicy: Local with tight externalAgentCidrs, narrows who
can try.
Pinning applies to messages that claim an identity (registration, and
everything carrying an agent_id). The one service whose calls carry no
identity, the domain event stream, is not served on the gateway at all since
2.5.0: WatchEvents there answers Unimplemented, and the console
subscribes on the in-cluster gRPC port. Diagnostics results are accepted
only from the agent a task was dispatched to.
Token-only mode has one more consequence since 2.4.0, and it deserves its own
paragraph. The controller now publishes every external agent's advertised
address as a Prometheus scrape target
(Scraping external agents), so a token holder
who registers a fictitious external agent with an address of their choosing
makes Prometheus connect to that host:port from the monitoring namespace:
an SSRF-shaped primitive, built from a credential that was only ever meant
to prove membership. Client-certificate pinning closes it, since a
registration then needs a certificate your CA issued for exactly that node
name. If you would rather write scrape targets by hand,
controller.prometheusSD.enabled: false closes the publishing side
altogether.
Cluster side: enable the gateway
The controller config block, with every key it accepts:
controller:
  externalGateway:
    enabled: true
    # Must differ from httpPort, grpcPort and metricsPort.
    port: 9443
    tls:
      # Serving pair; both REQUIRED when the gateway is enabled.
      certFile: /etc/kconmon-ng/gateway/tls.crt
      keyFile: /etc/kconmon-ng/gateway/tls.key
      # Optional: CA that signed the agent CLIENT certificates. Setting it
      # turns on mandatory verified client certs plus identity pinning.
      clientCaFile: /etc/kconmon-ng/gateway/ca.crt
    # REQUIRED. Content is trimmed; shorter than 16 characters is refused.
    bootstrapTokenFile: /etc/kconmon-ng/gateway/token
An enabled gateway refuses to start half-configured: missing cert, key or
token file is a startup error, never a silently-open listener. The gateway
serves the agent registry only: the domain event stream stays on the
in-cluster gRPC port even with controller.events.enabled on.
Rotation needs a controller restart, and the restart has a cost
The gateway reads the certificate and the token once at startup; the
config hot-reload does not rebuild the listener. After rotating either,
restart the controller (kubectl rollout restart deployment/...). Budget
the blast radius: on a leader change agents re-register within a few
heartbeats (a clean restart hands the lease over in about 2 seconds, a
crashed leader's lease runs out after 15), each
re-registration broadcasts a full peer-list resync to the whole fleet,
and any Console diagnostics run in flight records the pairs dispatched
into that window as failed. The agent side is friendlier: agents re-read
their certificate and token files on every dial, so a reconnect picks up
rotated material without a restart.
Helm values
The chart wires the same thing from two Secrets you create (or let cert-manager maintain):
controller:
  externalGateway:
    enabled: true
    port: 9443
    service:
      # NodePort | LoadBalancer; the rendered Service exposes the gateway
      # port ALONE, never the plaintext in-cluster gRPC port.
      type: LoadBalancer
      annotations: {}
      loadBalancerSourceRanges: []
      # Local preserves agent source IPs (what the NetworkPolicy matches);
      # Cluster NATs them to node IPs. See networkPolicy.externalAgentCidrs.
      externalTrafficPolicy: ""
    tls:
      # kubernetes.io/tls Secret with the serving pair (tls.crt/tls.key).
      secretName: kconmon-ng-gateway-tls
      # Key in that same Secret holding the client CA bundle; empty = token-only.
      clientCaKey: ca.crt
    bootstrapToken:
      secretName: kconmon-ng-gateway-token
      key: token

networkPolicy:
  # With the chart's NetworkPolicy enabled, name the external agents' source
  # CIDRs (plain strings) or the rendered gateway is unreachable by design.
  externalAgentCidrs:
    - 203.0.113.0/24
Generate a token once and store it:
kubectl create secret generic kconmon-ng-gateway-token \
  --from-literal=token="$(openssl rand -hex 32)"
Mind NAT: behind a NodePort or a LoadBalancer with
externalTrafficPolicy: Cluster (the apiserver default), the source IP the
gateway and the NetworkPolicy see is the node's, not the agent's. The
policy then needs the node CIDR in externalAgentCidrs, and the gateway's
per-source eviction of unauthenticated connections (above) cannot tell apart
the agents behind one node. Prefer externalTrafficPolicy: Local with tight
networkPolicy.externalAgentCidrs, at the cost of only the nodes running a
controller pod answering, or loadBalancerSourceRanges on a LoadBalancer.
The chart's install notes list the gateway under STILL TO DECIDE while it
runs with any other policy and no source ranges. The full knob list is in the
Helm values reference.
Host side: install the agent
Each release publishes the agent as a deb and an rpm for amd64 and
arm64 (assets named kconmon-ng-agent_<version>_<arch>.deb and
kconmon-ng-agent-<version>.<arch>.rpm on the
releases page):
The package installs:
/usr/bin/kconmon-ng-agent: the binary./usr/lib/systemd/system/kconmon-ng-agent.service: a hardened unit, a dedicatedkconmon-ngsystem user,NoNewPrivileges,ProtectSystem=strict, andCAP_NET_RAWgranted back via ambient capabilities so MTR hop tracing works unprivileged./usr/lib/sysctl.d/50-kconmon-ng.conf: opensnet.ipv4.ping_group_range, which the kernel requires for the ICMP checker's unprivileged datagram socket (CAP_NET_RAWdoes not cover it). The shipped range is wide because the package user's GID is allocated dynamically; narrow it in/etc/sysctl.dif your policy requires. The package applies its file at install only when no/etc/sysctl.conf,/etc/sysctl.dor/run/sysctl.dfile sets the key (in the dotted or the slash form,net/ipv4/ping_group_range), so a narrowed range survives upgrades. With systemd it applies the file by name throughsystemd-sysctl, which honours a same-name file in/etc/sysctl.dor/run/sysctl.dand a/dev/nullmask; without systemd it skips when such a same-name file exists./etc/kconmon-ng/config.yaml: a commented example config, marked as a conffile so upgrades never overwrite your edits.
The service is installed but not started: the shipped config points at a placeholder gateway. Edit the config (next section), then:
No packages for your platform? The same binary ships in the release
tarballs kconmon-ng_<version>_linux_amd64.tar.gz /
..._linux_arm64.tar.gz (alongside the controller binary). You then own the
unit file and the sysctl yourself; copy them from
packaging/agent/
in the repository. The agent reads /etc/kconmon-ng/config.yaml by default;
KCONMON_NG_CONFIG overrides the path.
Configure the agent
A complete external-agent config, with every gateway-related key:
# The controller's EXTERNAL GATEWAY, not the in-cluster gRPC port. The host
# part is also the name the server certificate is verified against, unless
# agent.tls.serverName overrides it.
controllerAddress: gateway.example.com:9443

agent:
  # Identity in the mesh; empty = this host's hostname. When the gateway
  # pins identities, the client cert CN (or a URI SAN) must equal this
  # name EXACTLY.
  nodeName: edge-host-01
  # The IP peers probe: an IP literal, no hostname, no port. Empty =
  # autodetected from the route towards controllerAddress. Set it
  # explicitly on NATed or multi-homed hosts.
  advertiseAddress: 203.0.113.10
  # Failure domain. In-cluster agents inherit it from the node label; an
  # external host has no node object, so an empty value here lands the
  # agent in the "" zone. Set it.
  zone: external
  tls:
    # TLS with nothing else set, verified against the system trust pool; not
    # needed here, since caFile below turns TLS on by itself.
    # enabled: true
    # CA that signed the GATEWAY's serving cert. Empty = the system trust
    # pool, but an empty caFile alone does not turn TLS on.
    caFile: /etc/kconmon-ng/ca.crt
    # Client pair: both or neither. Required when the gateway sets
    # tls.clientCaFile.
    certFile: /etc/kconmon-ng/client.crt
    keyFile: /etc/kconmon-ng/client.key
    # Verify the server cert against this name instead of the dialed host:
    # for dialing by IP or through a load balancer.
    serverName: ""
  # Same content as the controller's bootstrapTokenFile. Keep it mode 0600,
  # owned by the service user. Refused unless TLS is on (enabled, caFile,
  # the client pair or serverName): a token never rides plaintext.
  bootstrapTokenFile: /etc/kconmon-ng/bootstrap-token

checkers:
  dns:
    # Off in the packaged config: the default probe host,
    # kubernetes.default.svc.cluster.local, resolves only inside a cluster.
    # Turn it on with names this host must resolve.
    enabled: true
    hosts:
      - example.internal
Note the checkers.dns block. The packaged config ships
checkers.dns.enabled: false, because the built-in default host,
kubernetes.default.svc.cluster.local, is a name no bare host resolves and
the checker would fail from the first start. To check DNS from the host, set
enabled: true and a hosts list of names it must resolve, as above. An
installation from before 2.5.0 keeps its own config file on upgrade (it is a
conffile), so its DNS checker keeps failing until you do the same.
Rules the config loader enforces, so they fail at startup with a message rather than at registration:
agent.bootstrapTokenFilewithout TLS is refused: setagent.tls.enabled, acaFile, a client certificate or aserverName. An emptycaFilealone leaves the dial plaintext, and the token never rides plaintext. (The credential itself also refuses insecure transport at runtime, as a second net.)agent.tls.certFileandkeyFilego together; one without the other is an error.agent.advertiseAddressmust be an IP literal peers can reach; the controller publishes it fleet-wide as a probe target and rejects anything else. The unspecified address (0.0.0.0,::), loopback, multicast and255.255.255.255are refused at load; link-local, private and IPv6 addresses are fine. Without it, an autodetect that finds a loopback source (acontrollerAddressthrough a local tunnel,127.0.0.1:<port>) stops startup withset agent.advertiseAddress explicitly.
The agent.tls block is itself the switch: enabled: true or any other key
set in it moves the dial to TLS, while an empty block keeps the plaintext
in-cluster dial byte-identical. A gateway with a publicly trusted
certificate needs only enabled: true (2.5.0 or newer): the system trust
pool verifies it against the controllerAddress host.
Ports
httpPort, grpcPort and metricsPort are top-level keys, the same three
the in-cluster agents use (grpcPort is the UDP echo port on an agent; the
name is an old overload). Since 2.4.0 an agent reports all three at
registration and its peers probe it on the ports it reported, so an external
host may run on ports of its own: a host that registered httpPort: 18080 is
dialled on 18080 whatever the cluster pods listen on. metricsPort is never
probed; it is published for scrape discovery.
Ports are read once at startup with the rest of the identity, so a change
takes a service restart and reaches the peers with the re-registration. The
agent never adopts ports from the controller's registration reply; zone is
the only field it takes from there.
The rule that comes with it: keep one port set for the whole fleet until every agent, deb/rpm hosts included, runs 2.4.0. An older agent reports no ports and, worse, ignores the ports its peers report: it dials every peer on its own configured values, on-demand diagnostics included. In a fleet where ports differ, each old agent fails one way toward every peer on other ports, and the matrix shows one-way red on exactly those rows. A 2.3.x controller drops the port fields at registration, so behind an old controller the whole fleet stays on the fleet-wide contract as well.
Identity resolution (env over file over fallback) is shared with in-cluster
agents and spelled out in
Configuration → Agent identity. Two
external-specific notes. Identity is resolved once at startup, so changes to
the agent block take a service restart. And every agent that registers
through the gateway is labeled kconmon-ng.io/external=true in its
registration metadata. Since 2.5.0 the controller's listener sets the label,
not the agent: the gateway always adds it, and the in-cluster gRPC port drops
it if an agent claims it. A bare host registering through the plaintext
in-cluster port, which is not supported, counts as an in-cluster agent. The
label decides kconmon_ng_controller_external_agents, the Prometheus SD
target list and the missing-agents arithmetic, and it comes back verbatim in
every GET /api/v1/topology response (agents[].labels), which is how API
consumers tell bare-host agents apart.
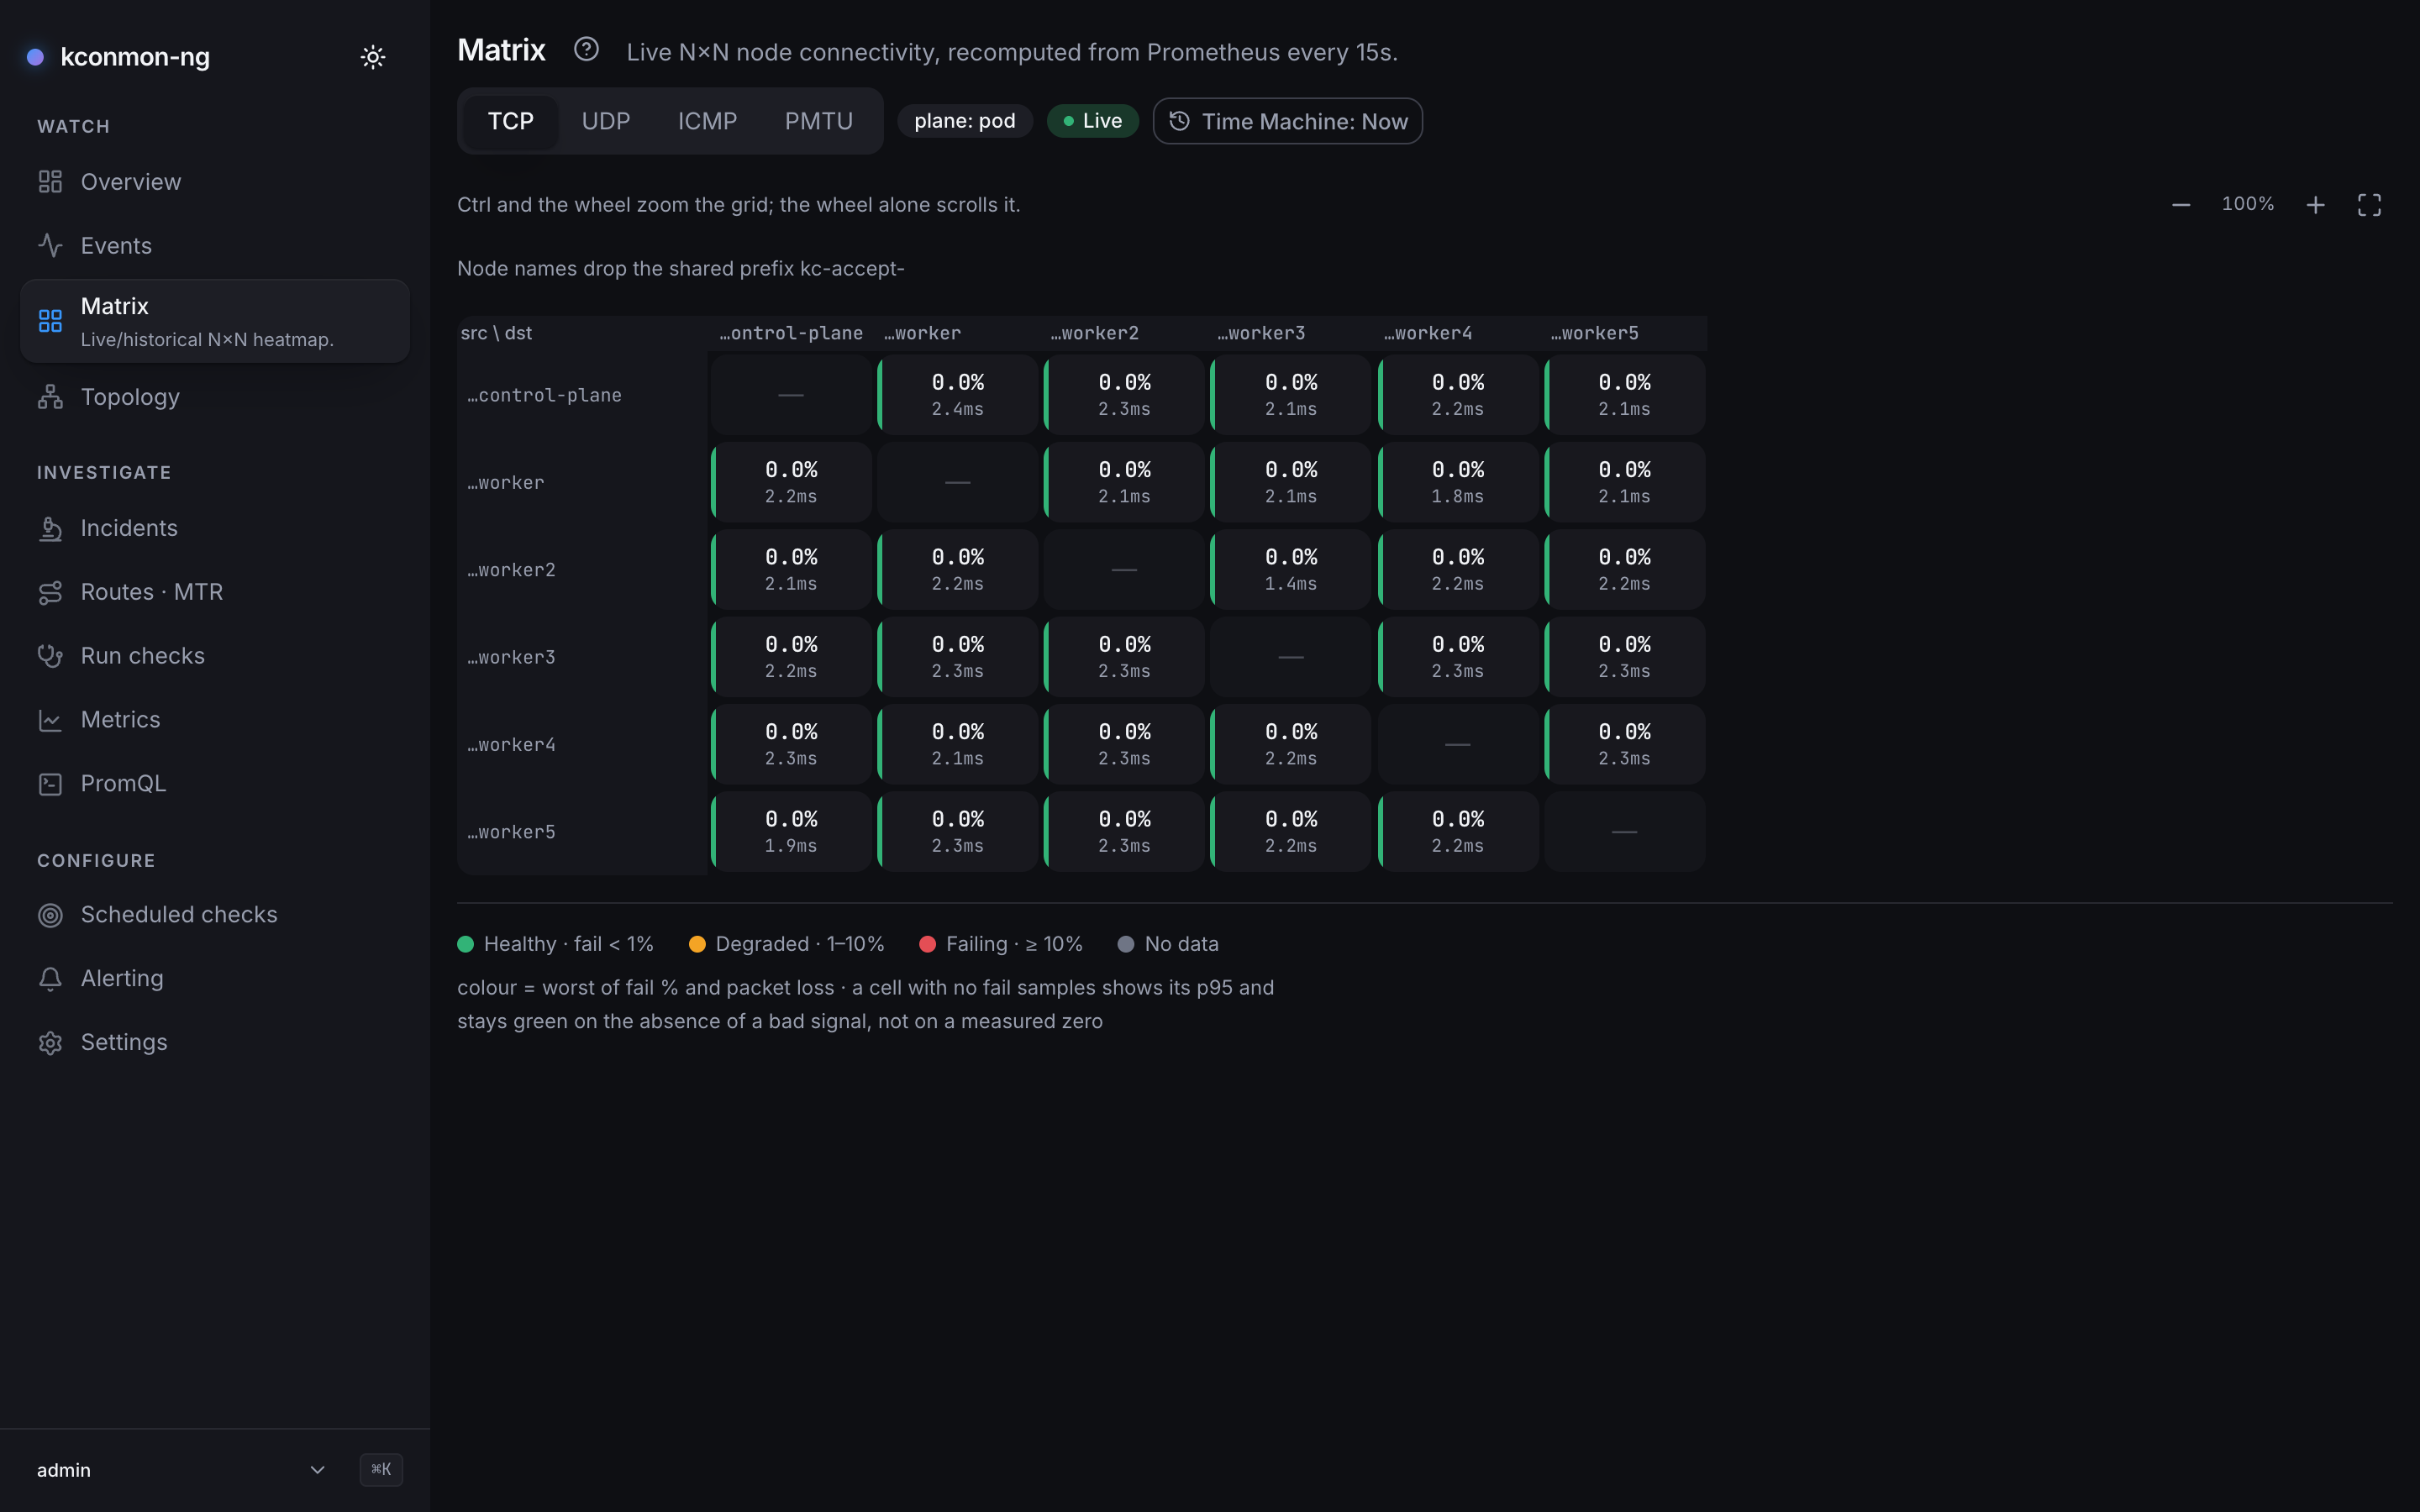
Since 2.4.0 the Console reads that label too. The Topology map draws the host
beside the cluster nodes with a neutral external badge and "readiness
unknown" (a bare host has no Kubernetes node to be ready); the node page
swaps Pod IP for Advertised address, notes that readiness is not reported
for an external host, and lists the probe planes the agent advertised
(TCP, UDP, ICMP, PMTU, MTR chips; "unknown" for an agent older than 2.4.0, which
advertises none); the Matrix marks the row and column header "external
agent"; Overview badges the name in Worst pairs and adds "+N external
agent(s)" beside the Nodes ready tile without counting them in, since that
count is Kubernetes readiness. When Prometheus is not scraping the host, the
Matrix says so instead of leaving a bare grey row: the tooltip on every cell
of that row and a note above the grid name the agent and link to
Scraping external agents. The CLI follows:
kubectl kconmon agents gained an EXTERNAL column and
kubectl kconmon topology prints bare-host rows after the node rows, with
-o json carrying labels and capabilities verbatim. All of it rides on the
label, so a 2.3.x console in front of a 2.4.0 controller shows the agent as
one more row under its zone with nothing marking it as external, and the
Time Machine can badge only history a 2.4.0 controller recorded, since older
topology events carry no labels.
When the gateway pins identities, issue each host a certificate whose CN
equals its nodeName (the resolved one: the hostname, if you did not set
the key). URI SANs work too, matched verbatim. v1 relies on a CA you already
operate: there is no CSR flow and no SPIFFE. A token store with per-agent
issuance, rotation and revocation is a project of its own, and a shared CA
covers the fleets this feature targets.
Open the firewall
Probes are peer-to-peer (results never transit the controller), so the mesh needs more than the gateway port:
| Path | Protocol / port | Purpose |
|---|---|---|
| agent ↔ agent | TCP httpPort (default 8080; each peer's own reported port since 2.4.0), both directions |
TCP connect probes; agent health endpoints |
| agent ↔ agent | UDP grpcPort (default 9090; likewise per peer since 2.4.0), both directions |
UDP loss/RTT probes (each agent's echo server) |
| agent ↔ agent | ICMP echo, both directions | ICMP RTT/loss; MTR hop tracing |
| agent → controller | TCP controller.externalGateway.port (default 9443) |
registration, peer list, heartbeats, tasks, results |
| Prometheus → agent | TCP metricsPort (default 9091; the port the SD body publishes) |
metrics scrape |
"Both directions" is literal: every fleet member probes every other, so the external host must accept these from the cluster's agents, and the cluster must accept them from the external host.
That table hides the real prerequisite: addresses must be routable both
ways. The external agent's advertiseAddress must be reachable from the
in-cluster agent pods, and the pod IPs the cluster agents advertise must be
routable from the external host. Without a routable pod network (BGP-
announced pods, cloud-native routing, a VPN that carries pod CIDRs), every
external↔cluster cell shows red. That is an accurate measurement of a
network that genuinely cannot deliver those packets, not a kconmon-ng bug.
Prometheus must likewise be able to reach the external host's metricsPort;
how it learns the address is the next section.
When the pod network does not route
The alternative to routing pod CIDRs to the host is agent.hostNetwork: true
in the chart: the agent DaemonSet moves into each node's network namespace,
advertises the node IP, and listens on TCP httpPort, UDP grpcPort and TCP
metricsPort of the node itself. An external host that can reach the nodes
can then reach every agent, with no BGP and no VPN carrying pod CIDRs.
The price is loud, and it is why the option is off by default: it changes
what is measured for the whole DaemonSet, not only where the pods listen.
Every in-cluster pair then probes node IP to node IP over the underlay, and
the CNI datapath (overlay, conntrack, NetworkPolicy enforcement) is no longer
exercised, so the failure class this tool exists to catch hides behind a
green matrix. Diagnostics keep reporting plane=pod either way; read the
field as "the addresses the agents advertise", as
Mesh and planes explains.
Turn it on only when the goal is visibility between external agents and a
cluster whose pod network the hosts cannot route to.
What must already be true, because each miss fails in its own quiet way:
- The namespace runs at PSS
privilegedor is exempted:baselinerefuseshostNetworkat admission while the release still looks healthy. - TCP
httpPort, UDPgrpcPortand TCPmetricsPortare free on every node (ss -lntupfirst; Calico's Felix metrics also default to 9091 when enabled). An occupied port crash-loops the agent on that node alone and firesKconmonAgentsMissing. The kubelet's liveness and readiness probes now hit the node's port 8080 as well. net.ipv4.ping_group_rangeis set by the node OS (asysctl.dfile, the same line the deb/rpm ships): the kubelet refusesnet.*pod sysctls under host networking, so the chart stops rendering it.networkPolicy.nodeCidrsis set whennetworkPolicy.enabled: registrations now arrive from node IPs, which no pod selector matches, and the chart refuses to render the policy without the list. On Cilium the list matches nothing, since node IPs are theremote-nodeandhostentities there; the<fullname>-node-ingressCiliumNetworkPolicythatnetworkPolicy.ciliumKubeAPIEgressrenders underagent.hostNetworkadmits them to the controller'sgrpcPort.agent.dnsPolicycan stay empty: the chart rendersClusterFirstWithHostNetunder host networking, becausecontrollerAddressis a bare Service name that only cluster DNS resolves.
hostNetwork and dnsPolicy are pod-template fields, so flipping them rolls
the DaemonSet; during the rollout a mixed fleet (node IPs next to pod IPs)
keeps working, with some transient PairWentSilent noise. A host-network
agent from a 2.4.0 image also labels itself kconmon-ng.io/host-network=true,
so GET /api/v1/topology tells the two address kinds apart.
One rule closes the section: a machine cannot run both a host-network agent pod and a bare-host external agent. They would share one IP and the same three ports: the agents' self filter skips any peer with their own node name or address, so neither would probe the other, and the second one to start cannot bind its listeners anyway. One agent per machine.
Scraping external agents
An in-cluster agent is found by the chart's ServiceMonitor through its
Service. A bare host has no Service, so before 2.4.0 nothing scraped it: the
agent's column in the Matrix filled in (the cluster probes it), its row
stayed grey (nobody read its own probes), and its zone metrics and worst
pairs were blind to everything it measured. Since 2.4.0 the controller, the
one party that knows a host registered and on which address, tells
Prometheus itself: GET /api/v1/prometheus/sd answers in the
HTTP service discovery
format with one target group per external agent, served on metricsPort
(the port the chart's scrape NetworkPolicy already opens) and on httpPort
alike. The body and its rules are in the
API reference.
With the Prometheus Operator
The chart renders a ScrapeConfig (the scrapeconfigs.monitoring.coreos.com
CRD; kubectl get crd scrapeconfigs.monitoring.coreos.com tells you whether
your operator ships it) pointing at the endpoint:
scrapeConfig:
  externalAgents:
    enabled: true
    # Selector labels YOUR Prometheus requires. kube-prometheus-stack selects
    # only ScrapeConfigs labelled release=<its release name>; an operator with
    # an empty scrapeConfigSelector needs nothing here.
    labels:
      release: kube-prometheus-stack
    # Empty = <release>-agent-external. Keep "kconmon" in it: the bundled
    # dashboards filter on job=~".*kconmon.*".
    jobName: ""
    # How often Prometheus re-reads the target list; matches config.controllerAgentTtl.
    refreshInterval: 30s
    # Scrape interval; empty falls back to serviceMonitor.interval.
    interval: ""
The object is named <release>-agent-external, carries the chart labels plus
whatever you put in labels, and applies the same agent.metrics.detail
cardinality valve as the agent ServiceMonitor, so an external host never
returns per-pair detail the valve dropped for the pods. Two guards refuse
combinations that cannot work: the ScrapeConfig without
controller.externalGateway.enabled (no gateway, no external agents, an
empty target list forever) and without controller.prometheusSD.enabled
(the endpoint would answer 404 on every refresh). The install notes print a
reminder when the gateway is on and the ScrapeConfig is not, and another when
labels is empty, since a kube-prometheus-stack Prometheus silently ignores
an unlabelled object.
Plain Prometheus
Without the operator, the same discovery is one http_sd_configs job. Keep
agent-external in the job name (the optional KconmonExternalAgentDown
alert matches on it) and kconmon (the dashboards filter on it):
- job_name: kconmon-ng-agent-external
  http_sd_configs:
    - url: http://kconmon-ng-controller.kconmon-ng.svc:9091/api/v1/prometheus/sd
      refresh_interval: 30s
  # The agent.metrics.detail valve by hand; drop the block to keep full detail.
  metric_relabel_configs:
    # counters-only: drop the four per-pair histograms.
    - source_labels: [__name__]
      regex: kconmon_ng_(tcp_connect_duration|tcp_total_duration|udp_rtt|icmp_rtt)_seconds_(bucket|sum|count)
      action: drop
    # zone-only instead: a per-pair series is exactly one naming a destination node.
    # - source_labels: [destination_node]
    #   regex: .+
    #   action: drop
Adjust the Service name and namespace to your release
(<release>-controller.<namespace>.svc:<config.metricsPort>). The targets
arrive labelled node, zone, external="true" and agent_id, and nothing
else: an agent's own labels never reach Prometheus.
What to expect
- Leader only. The endpoint answers
503 not the leaderfrom a standby, never an empty list, because Prometheus treats every200as the complete new target set and a standby's[]would wipe every external target. On a non-200 Prometheus keeps the list it has. Withcontroller.replicaCount > 1the Service spreads refreshes over all replicas, so roughly half of them land on a standby:prometheus_sd_http_failures_totalclimbs for the job while the targets stay correct. Cosmetic, and written down here so nobody chases it. - Reachability is yours. The chart's NetworkPolicy admits the scraper to
metricsPort; egress from the monitoring namespace to the hosts is your policy, not the chart's. On most CNIs a pod's egress is NATed to the node IP, so the host firewall must admit the node CIDR, not "the Prometheus pod's IP". A target the controller lists but Prometheus cannot reach sits atup == 0;prometheusRule.externalAgentDown.enabledturns that into a warning after 5 minutes. - A 2.3.x host in a 2.4.0 fleet reports no metrics port, so the
controller assumes its own
config.metricsPortand logsmetrics port assumed from controller configonce per agent. A host on a different port then showsup == 0with that log line as the clue: upgrade the package, or move the host to the fleet port. KconmonAgentsMissingno longer counts external agents. Registered agents include them and expected agents (schedulable nodes) never did, so one external agent used to mask one missing cluster node. Since 2.4.0 the controller exports<prefix>_controller_external_agentsand the rule subtracts it.
What v1 does not do
The limits, so they are a decision you make up front. Per-agent ports, scraping and console awareness were the v1 gaps 2.4.0 closed; what remains:
- Linux only. The agent builds for Windows, and TCP, UDP, DNS and HTTP
would work as written, but ICMP and MTR would not: the ICMP checker sits on
a datagram ICMP socket that
golang.org/x/net/icmpsupports only on Linux and Darwin by its own contract, and raw ICMP on Windows needs the Administrators group, so an agent that also runs on-demand probes for the controller would run as SYSTEM. Go's monotonic clock on Windows is also interrupt-tick granular (up to 15.6 ms), so a sub-millisecond LAN round trip would read as zero or as one tick while the histograms looked valid. A Windows vantage point (TCP, UDP, DNS and HTTP, with ICMP and MTR explicitly unsupported) is designed but not scheduled; the trigger is a concrete host that needs it. CI keepsGOOS=windows go vetgreen on the agent and checker trees so the door stays open at no cost. - Token-only mode allows impersonation inside the fleet. Any token holder can register under any node name, or attach to another agent's subscriptions and heartbeats. The token authenticates membership, nothing finer. That is acceptable when every token holder is equally trusted; otherwise set the client CA and get per-agent pinning, remembering the identity-less-message caveat in the trust model above.
- Pinning has one inherent ambiguity. Agent IDs join node and pod name
with
-, so a certificate for nodenode-1may also speak for IDs of a node literally namednode-1-0(the prefix rule cannot tellnode-1+ pod0-xfromnode-1-0+ podx). It can never act fornode-10, though: the separator is part of the match. Avoid node names that are dash-prefixes of each other. - WAN timing needs config. Agents heartbeat every 5 seconds (fixed),
and the controller evicts after
controller.agentTtl: 30s by default, tuned for a LAN. On WAN or VPN links that default turns every blip into an evict/re-register cycle, and each re-registration triggers a full peer-list resync for the whole fleet. Raise the TTL to minutes (controller.agentTtl: 5m; Helm:config.controllerAgentTtl) for fleets with external members. - Rotation is asymmetric: gateway cert and token need a controller restart, agent cert and token are picked up on the next reconnect.
The reverse direction
If what you actually need is probing an external destination (a DNS server, a storage array, a SaaS endpoint), you do not need an external agent at all: in-cluster agents can probe outward continuously via external checks, with no new trust surface. External agents are for when the vantage point must be outside the cluster.