Diagnose a slow pair
Symptom
An application team reports that traffic between two services is slow:
sometimes, for some replicas. Classic partial failure: node-level health is
green, kubectl get nodes says Ready, and the only hard fact is a latency
graph that looks worse than last week. The question kconmon-ng can answer:
is the network between specific nodes actually slower, on which protocol,
and at which hop?
Localize with the Matrix
Open the Console's Matrix and flip through the protocols. "Off-colour" has exact numbers here: the whole console ranks on two thresholds, degraded at 1%, failing at 10%, applied to the worse of a cell's failure ratio and its packet-loss ratio. They are defined once in the console source so the Matrix legend, Overview tiles, node colouring and topology edge filter cannot drift apart, and they are not configurable. You are looking for structure, not a single number:
- One cell off-colour → one directed pair. Check the mirror cell: if
A → Bis bad andB → Ais clean, the problem is directional. Think asymmetric routing or a policy on the return path. - A row or column → one node, outbound or inbound respectively.
- A block aligned with zones → a zone boundary; confirm on the zone view.
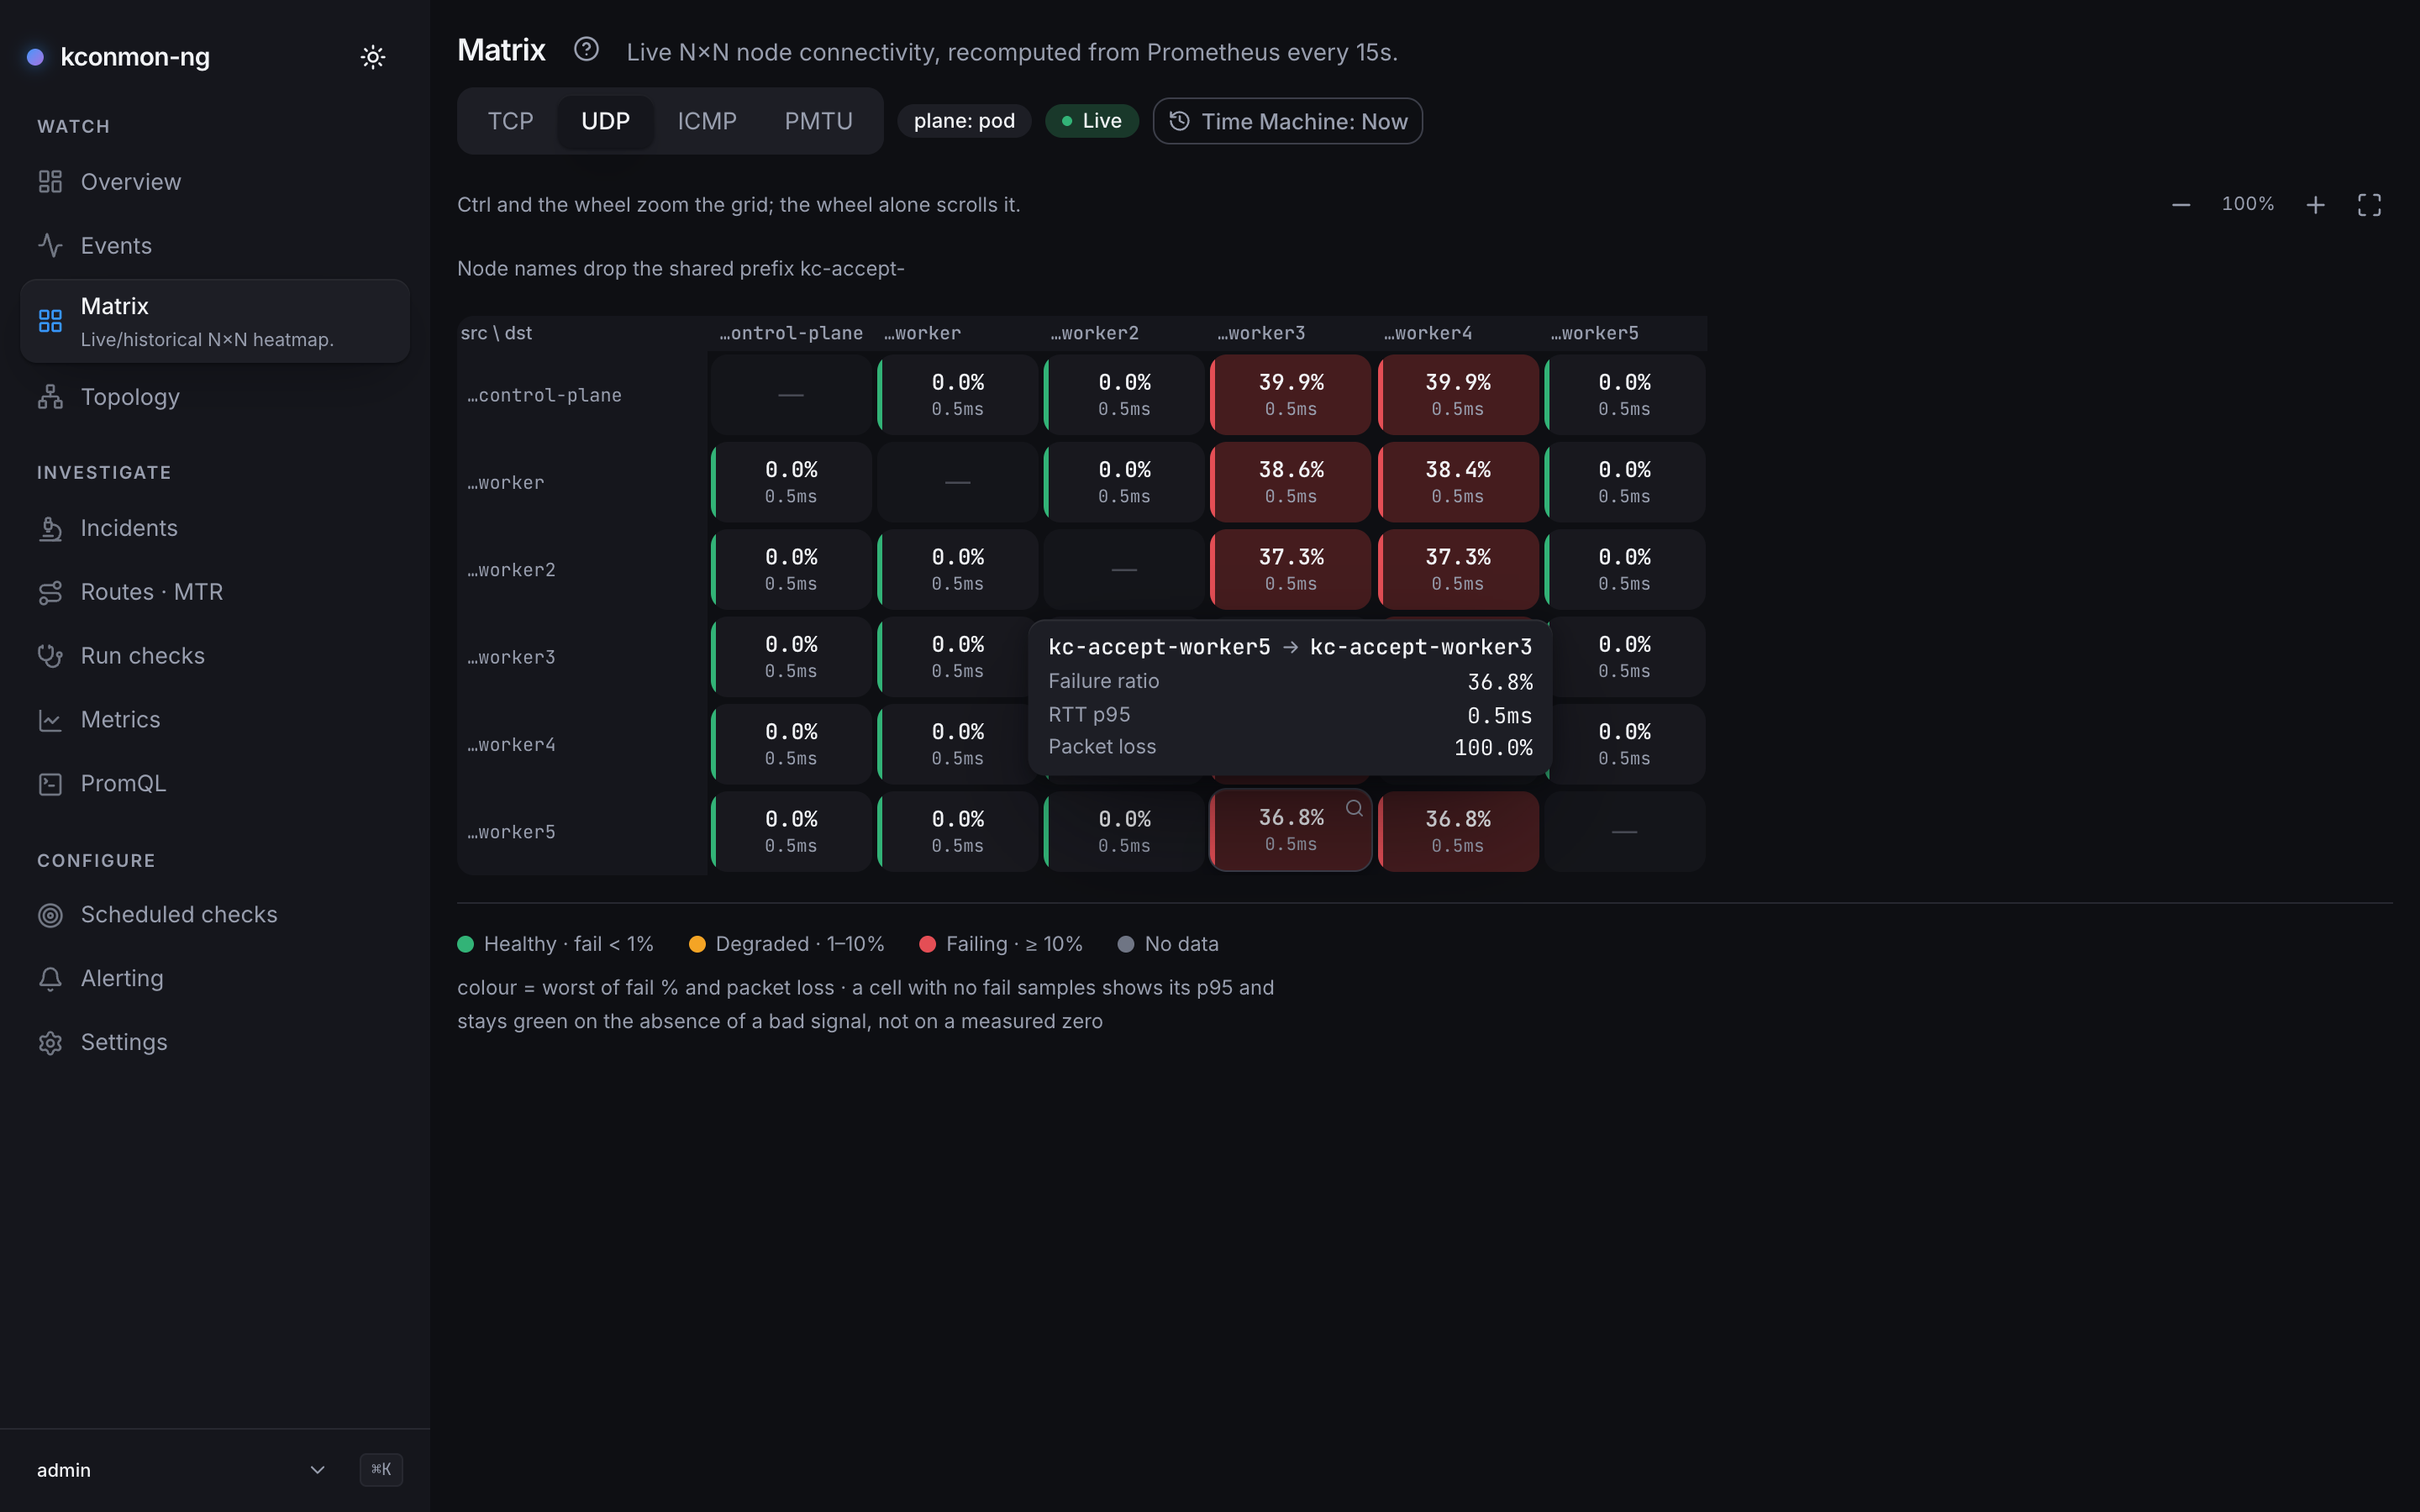
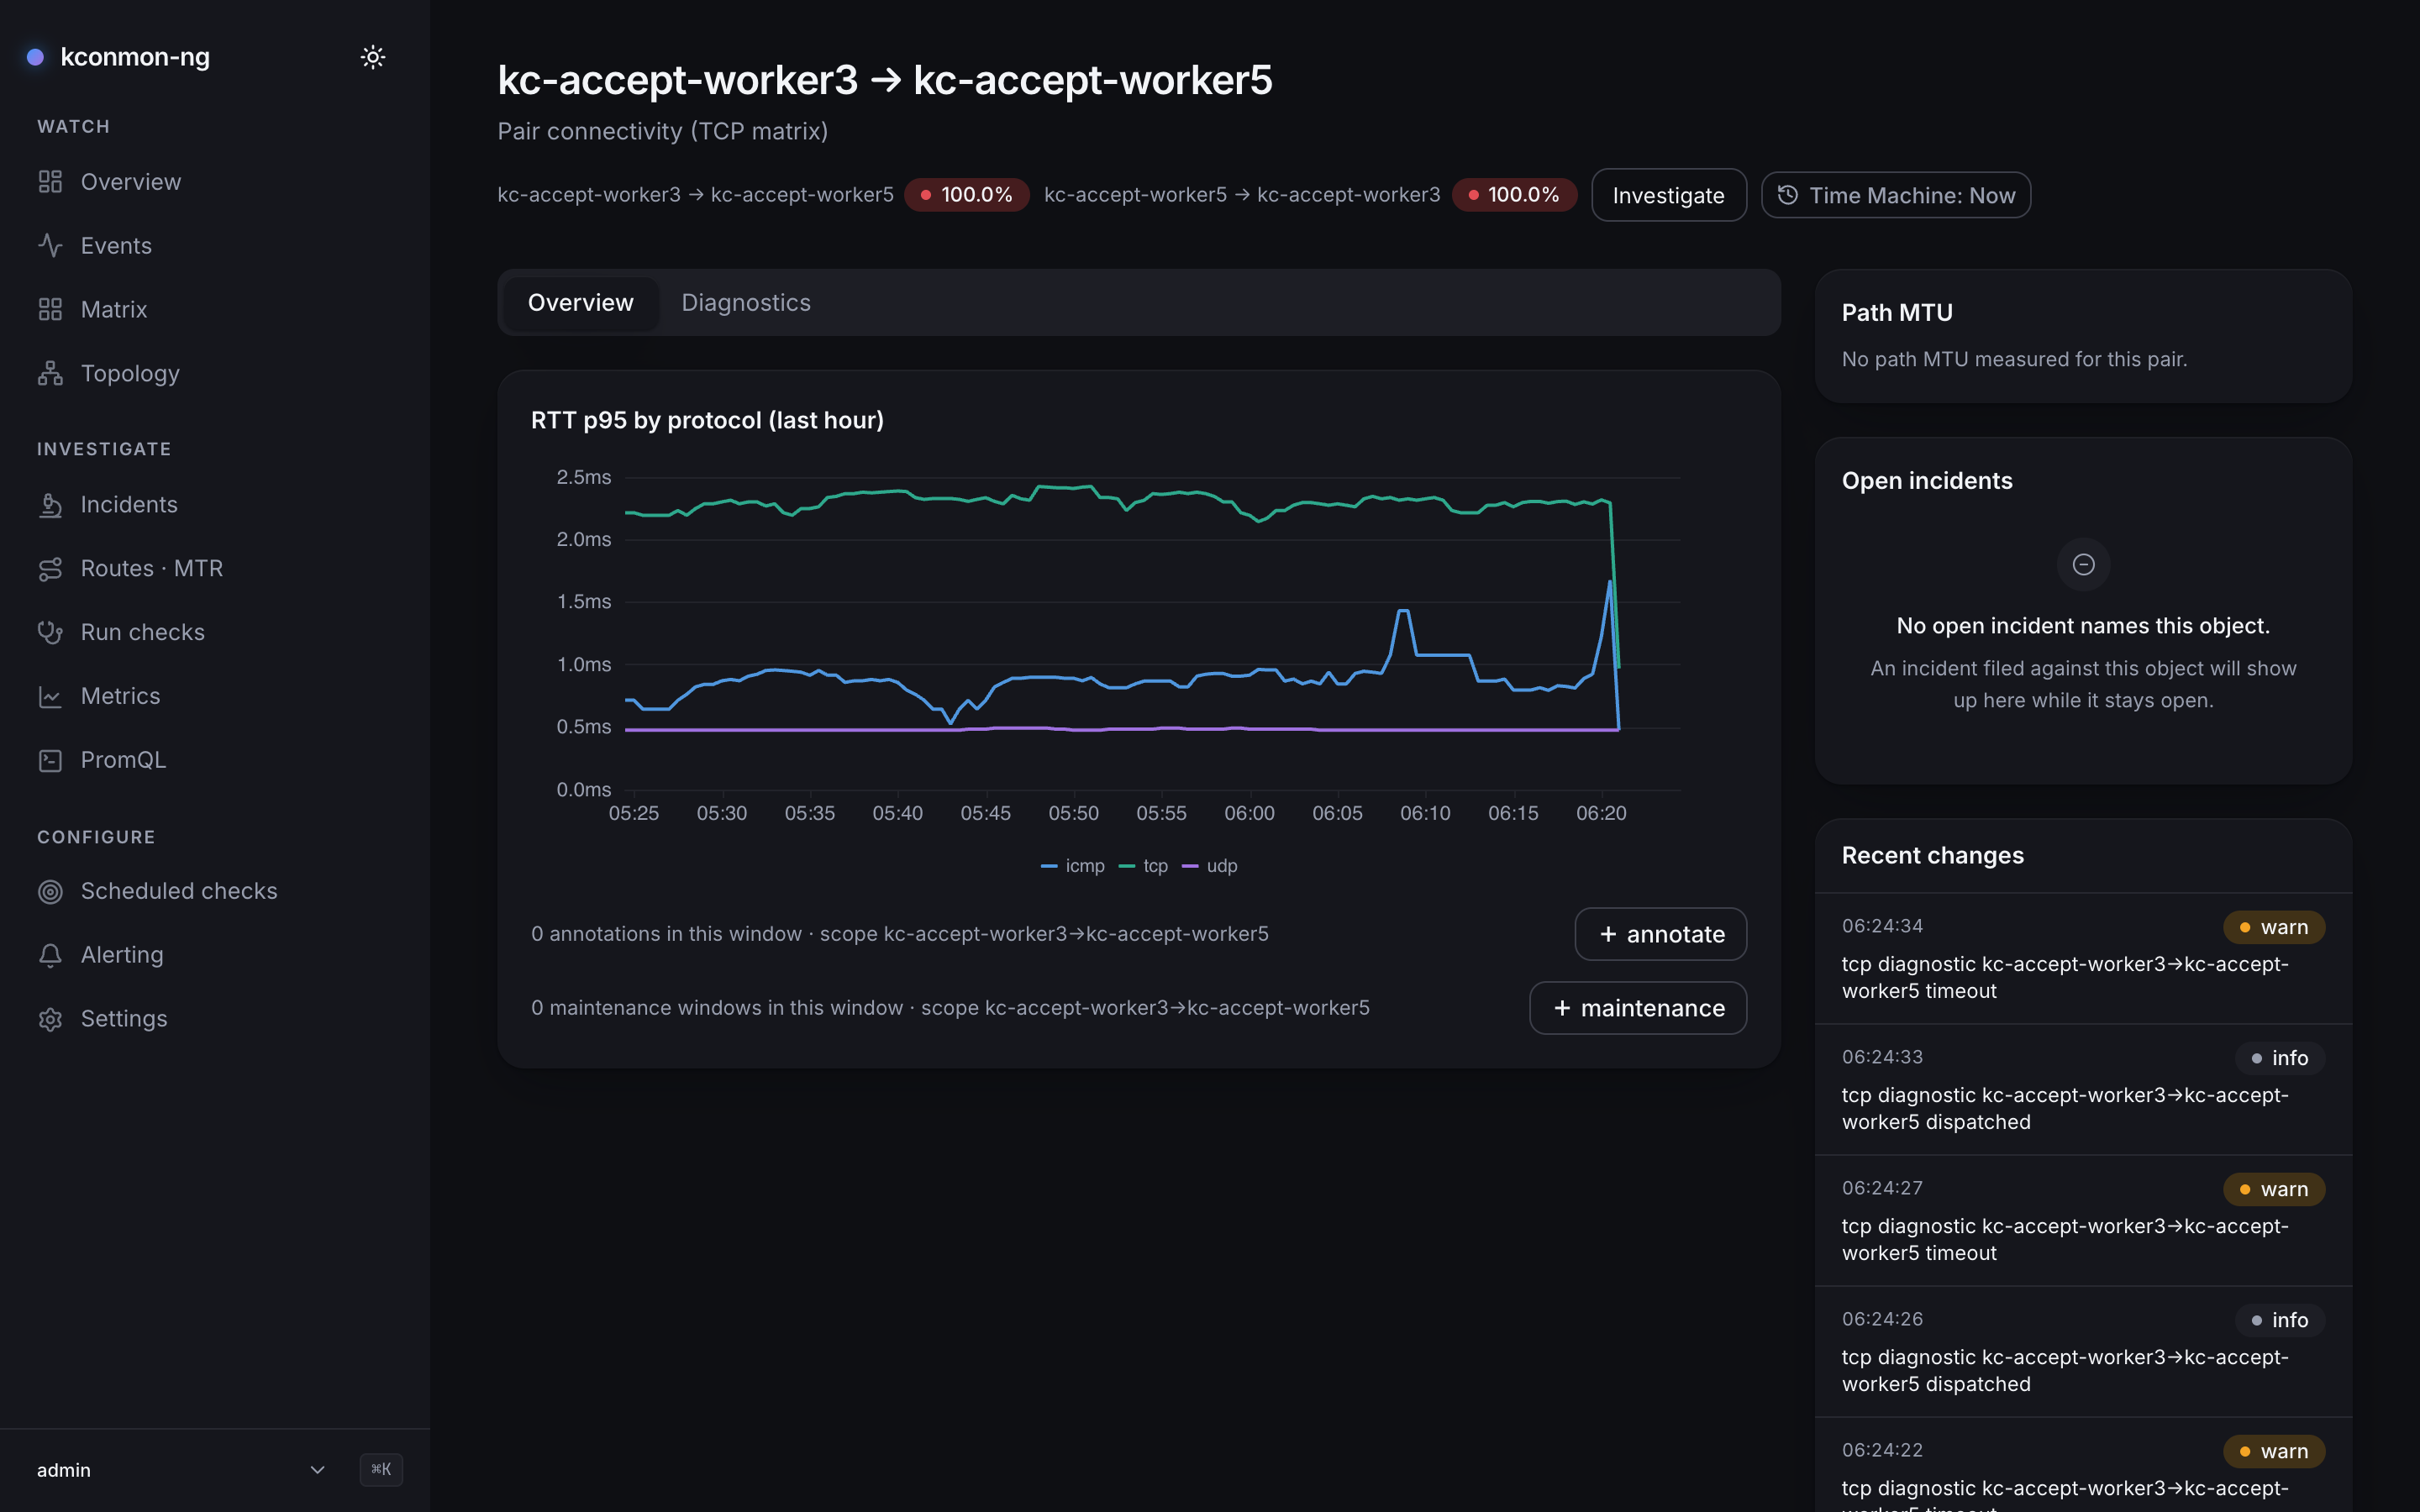
Click the suspect cell to open the pair page: loss and RTT charts for that pair, recent MTR path history, and the events around it. If the fleet is large, the Overview page's worst-pairs table is the shortcut to the same cell.
The pair page below comes from a larger break on the same stand, with zone-c
(worker6 and worker7) blackholed on every protocol. That is why
worker3 → worker6 fails in both directions there, while the UDP matrix
above shows the same cell green.
Confirm with Metrics
The Metrics page (or your own Prometheus) turns "looks slow" into numbers. RTT distributions are histograms, so ask for a quantile, here for the pair the Matrix pointed at:
# p99 TCP round-trip for one directed pair, over 10-minute windows
histogram_quantile(0.99, sum by (le) (
  rate(kconmon_ng_tcp_total_duration_seconds_bucket{
    source_node="node-a", destination_node="node-b"}[10m])))
Empty result? Check the cardinality valve first
This query reads the per-pair histograms, and the
agent.metrics.detail scrape valve drops exactly those:
counters-only and zone-only both discard the per-pair _bucket
series at scrape time, so on such a fleet the quantile silently returns
nothing. That is the valve working, not the pair being unmeasured; see
the levers table.
While you have the query editor open, separate three things:
- Latency or loss?
kconmon_ng_udp_packet_loss_ratioandkconmon_ng_icmp_packet_loss_ratiofor the same pair. Loss retries dressed up as latency is a different investigation than genuinely slow forwarding. - Jitter:
kconmon_ng_udp_jitter_seconds. A congested or rerouted path usually shows variance before it shows sustained slowness. - A healthy pair in the same zone pairing, as a control, to separate "this link" from "everything in that direction".
Use A/B compare on the Metrics page for the last one, or add a second selector in PromQL.
Find the hop with MTR
If loss is involved, traces already exist. The trigger is literally "the
probe failed": a failed TCP, UDP or ICMP check fires an MTR trace for its
pair, rate-limited by a per-pair cooldown (config.checkers.mtr.cooldown,
60s by default; the hop ceiling is config.checkers.mtr.maxHops, 30, legal
range 1–64). Slowness alone never triggers a trace (there is no
latency-threshold trigger), so for a pair that is slow without failing,
nothing will appear on its own. Fire one yourself from
Run checks (check type mtr), or from a
terminal:
kubectl-kconmon installs from the krew index
(kubectl krew install kconmon) and needs nothing exposed: it finds the
running controller pods by their labels (app.kubernetes.io/name=kconmon-ng,
app.kubernetes.io/component=controller; every namespace unless -n is
given), starts with the Lease holder, and port-forwards to that pod's http
port with your kubeconfig. It drives the same leader-only diagnostics
endpoint the Console uses and needs a running kconmon-ng in the cluster.
Leases are listed only in the namespaces where controller pods run, so
leases list RBAC in the release namespace is enough. When the pod it
picked answers 503 not the leader or leadership lost (no Lease it could
read, or a leader that just changed), it moves on to the next running
controller pod, one extra port-forward each; if that pod
cannot be reached either, the error names both (controller returned HTTP
503: not the leader; the next controller pod could not be reached: ...).
Open Routes · MTR and pick the destination. Path history is deduplicated by content, so what you see is the list of path changes, with a diff view between any two traces.
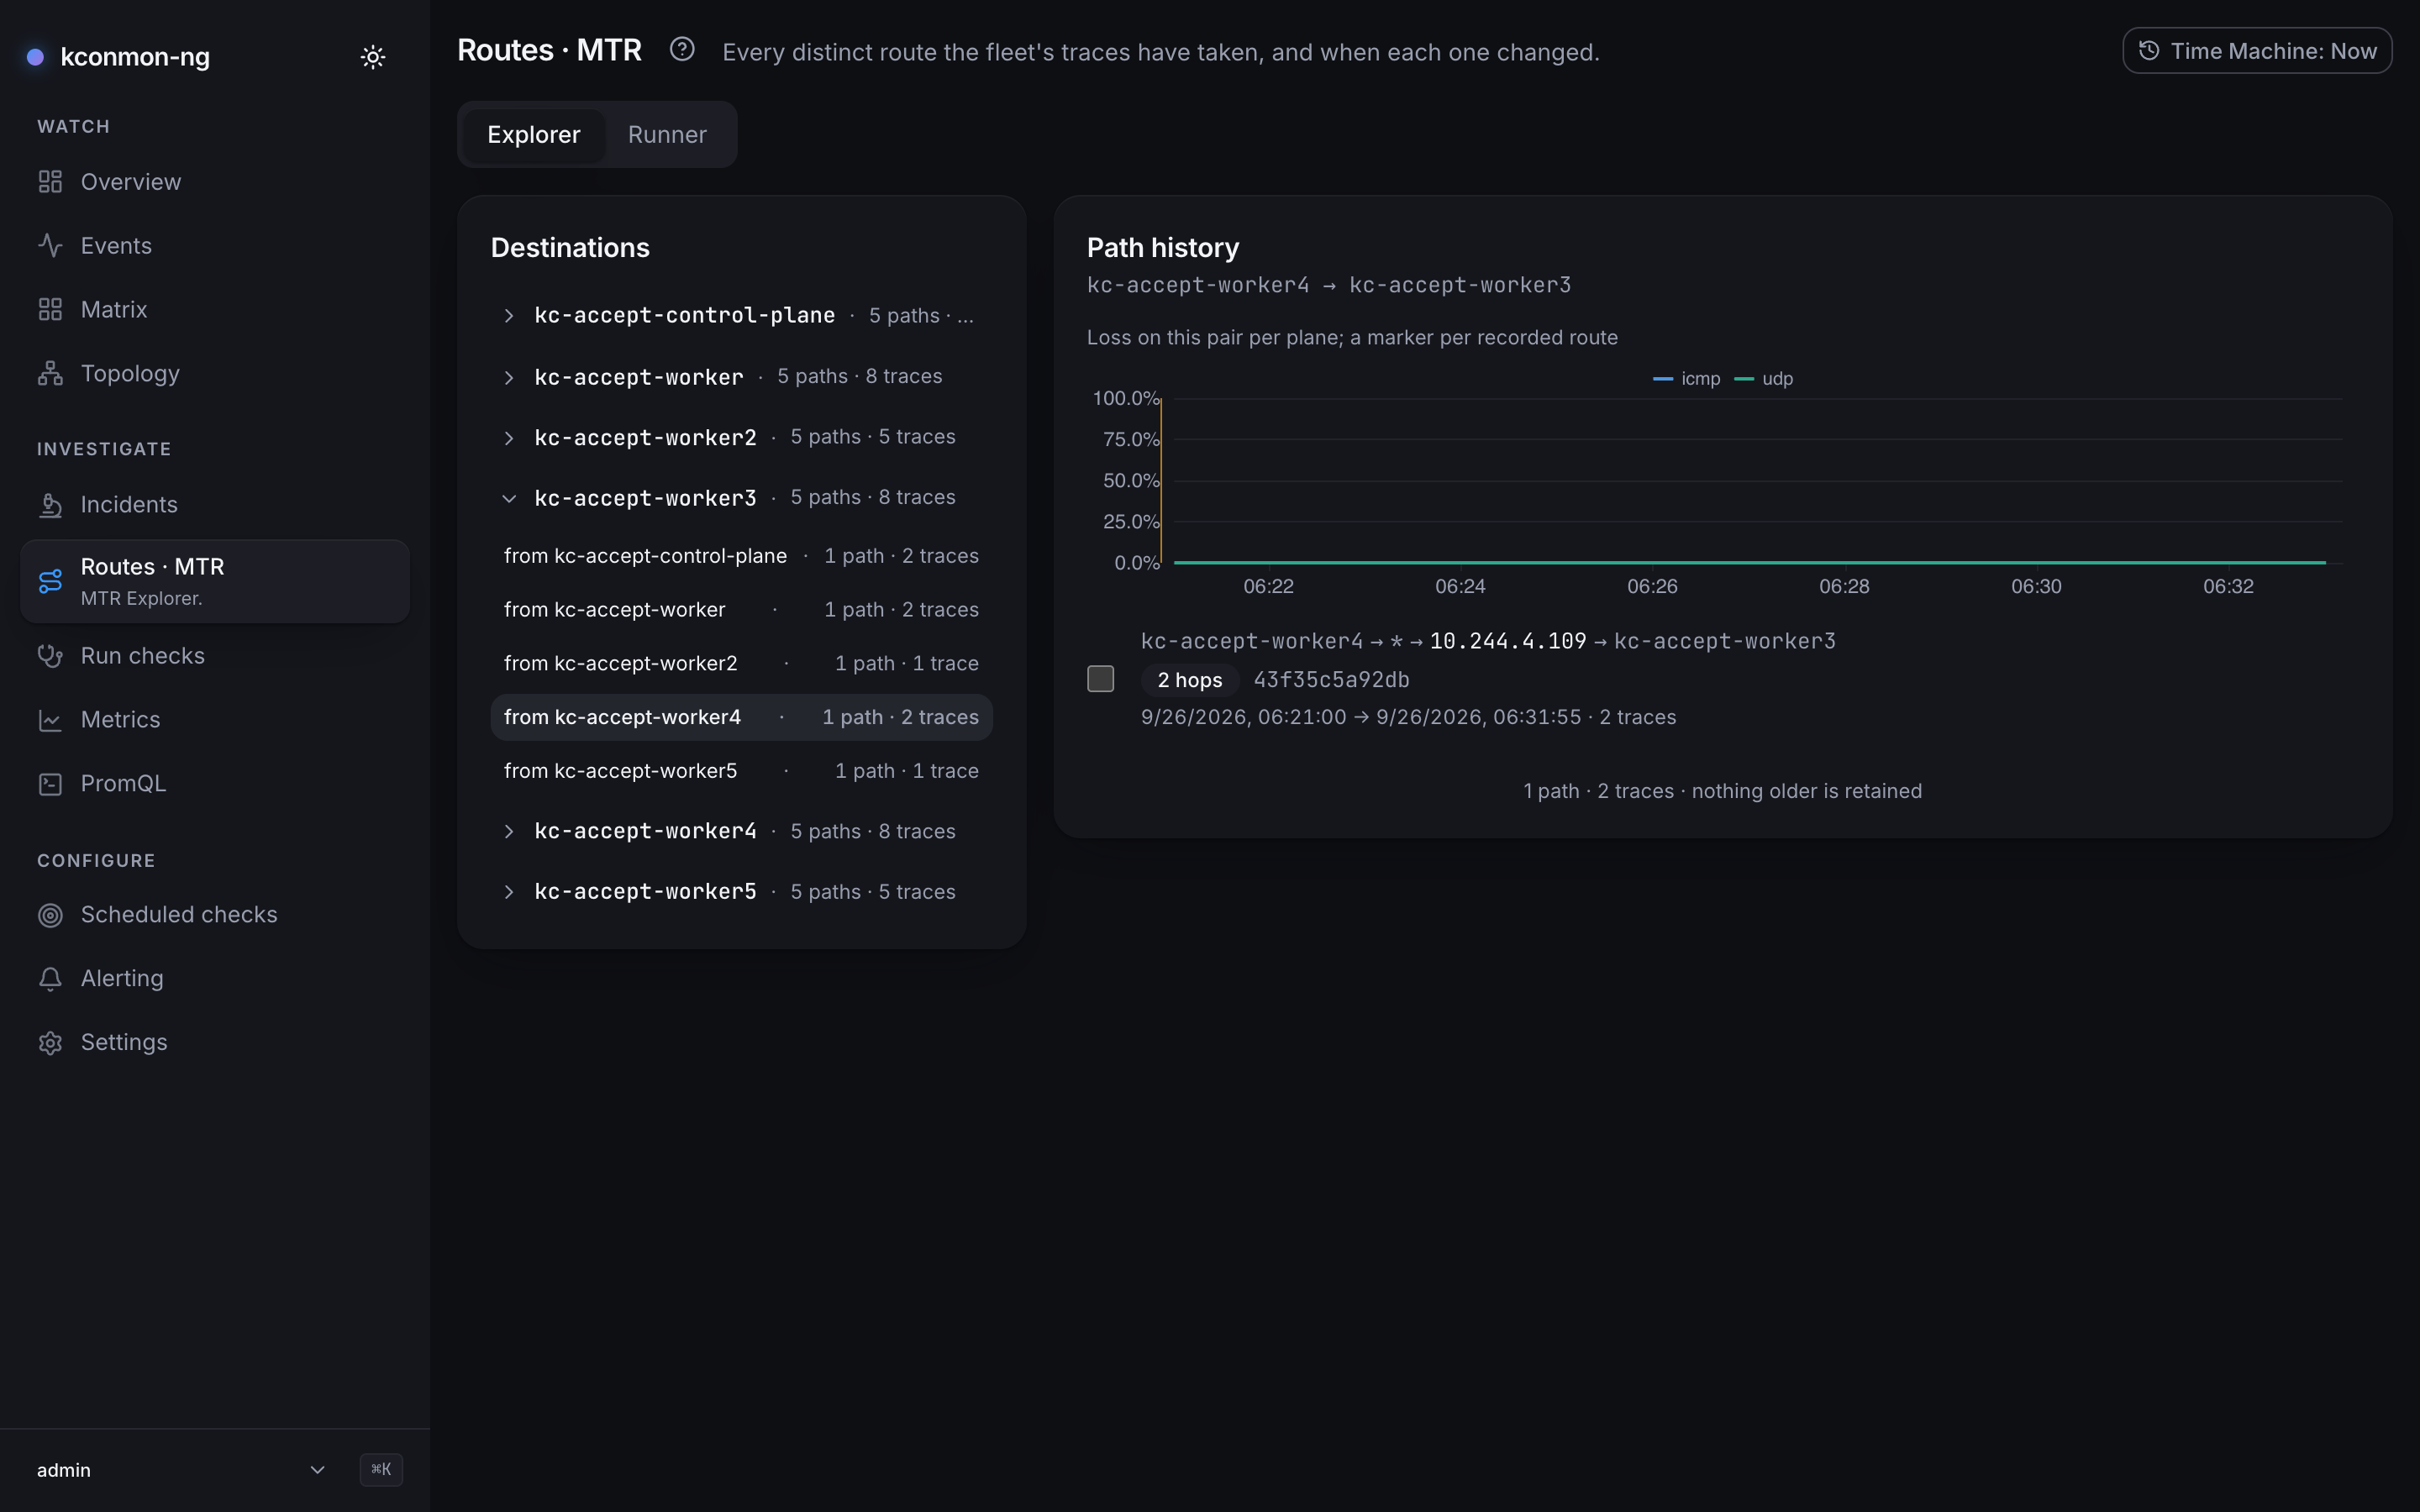
Read the hop table for where RTT jumps or per-hop loss starts: everything before that hop is fine, the problem lives at or after it. A path that changed around the time the symptom started (an extra hop, a different middle) is your correlation; the pair page's history shows when.
Fix and verify
The fix is yours: restart the misbehaving CNI daemon, toggle the offload, revert yesterday's firewall change. Verification is the same loop backwards, and it is cheap:
- Re-run the quantile query: p99 back at baseline.
- The Matrix cell back under the 1% degraded threshold, both directions.
- A fresh MTR run showing the expected path again.
If this was an incident worth remembering, save it as one on the Incidents page: the permalink rehydrates the exact scope and window, and the Time Machine can replay the console at the minute it broke for the postmortem. If the pair deserves a tighter watch than the bundled rules give it, declare a scoped rule for it; see Set up alerting.