Metrics
Curated metric charts: the fleet's key series over time, compared with each other or with an earlier window. This is trend context, the page you open when the question is "what did this look like an hour before the alert".
Note
This chapter documents the console's Metrics screen. The reference for the exported Prometheus metrics and the chart-shipped alert rules is Metrics and alerting.
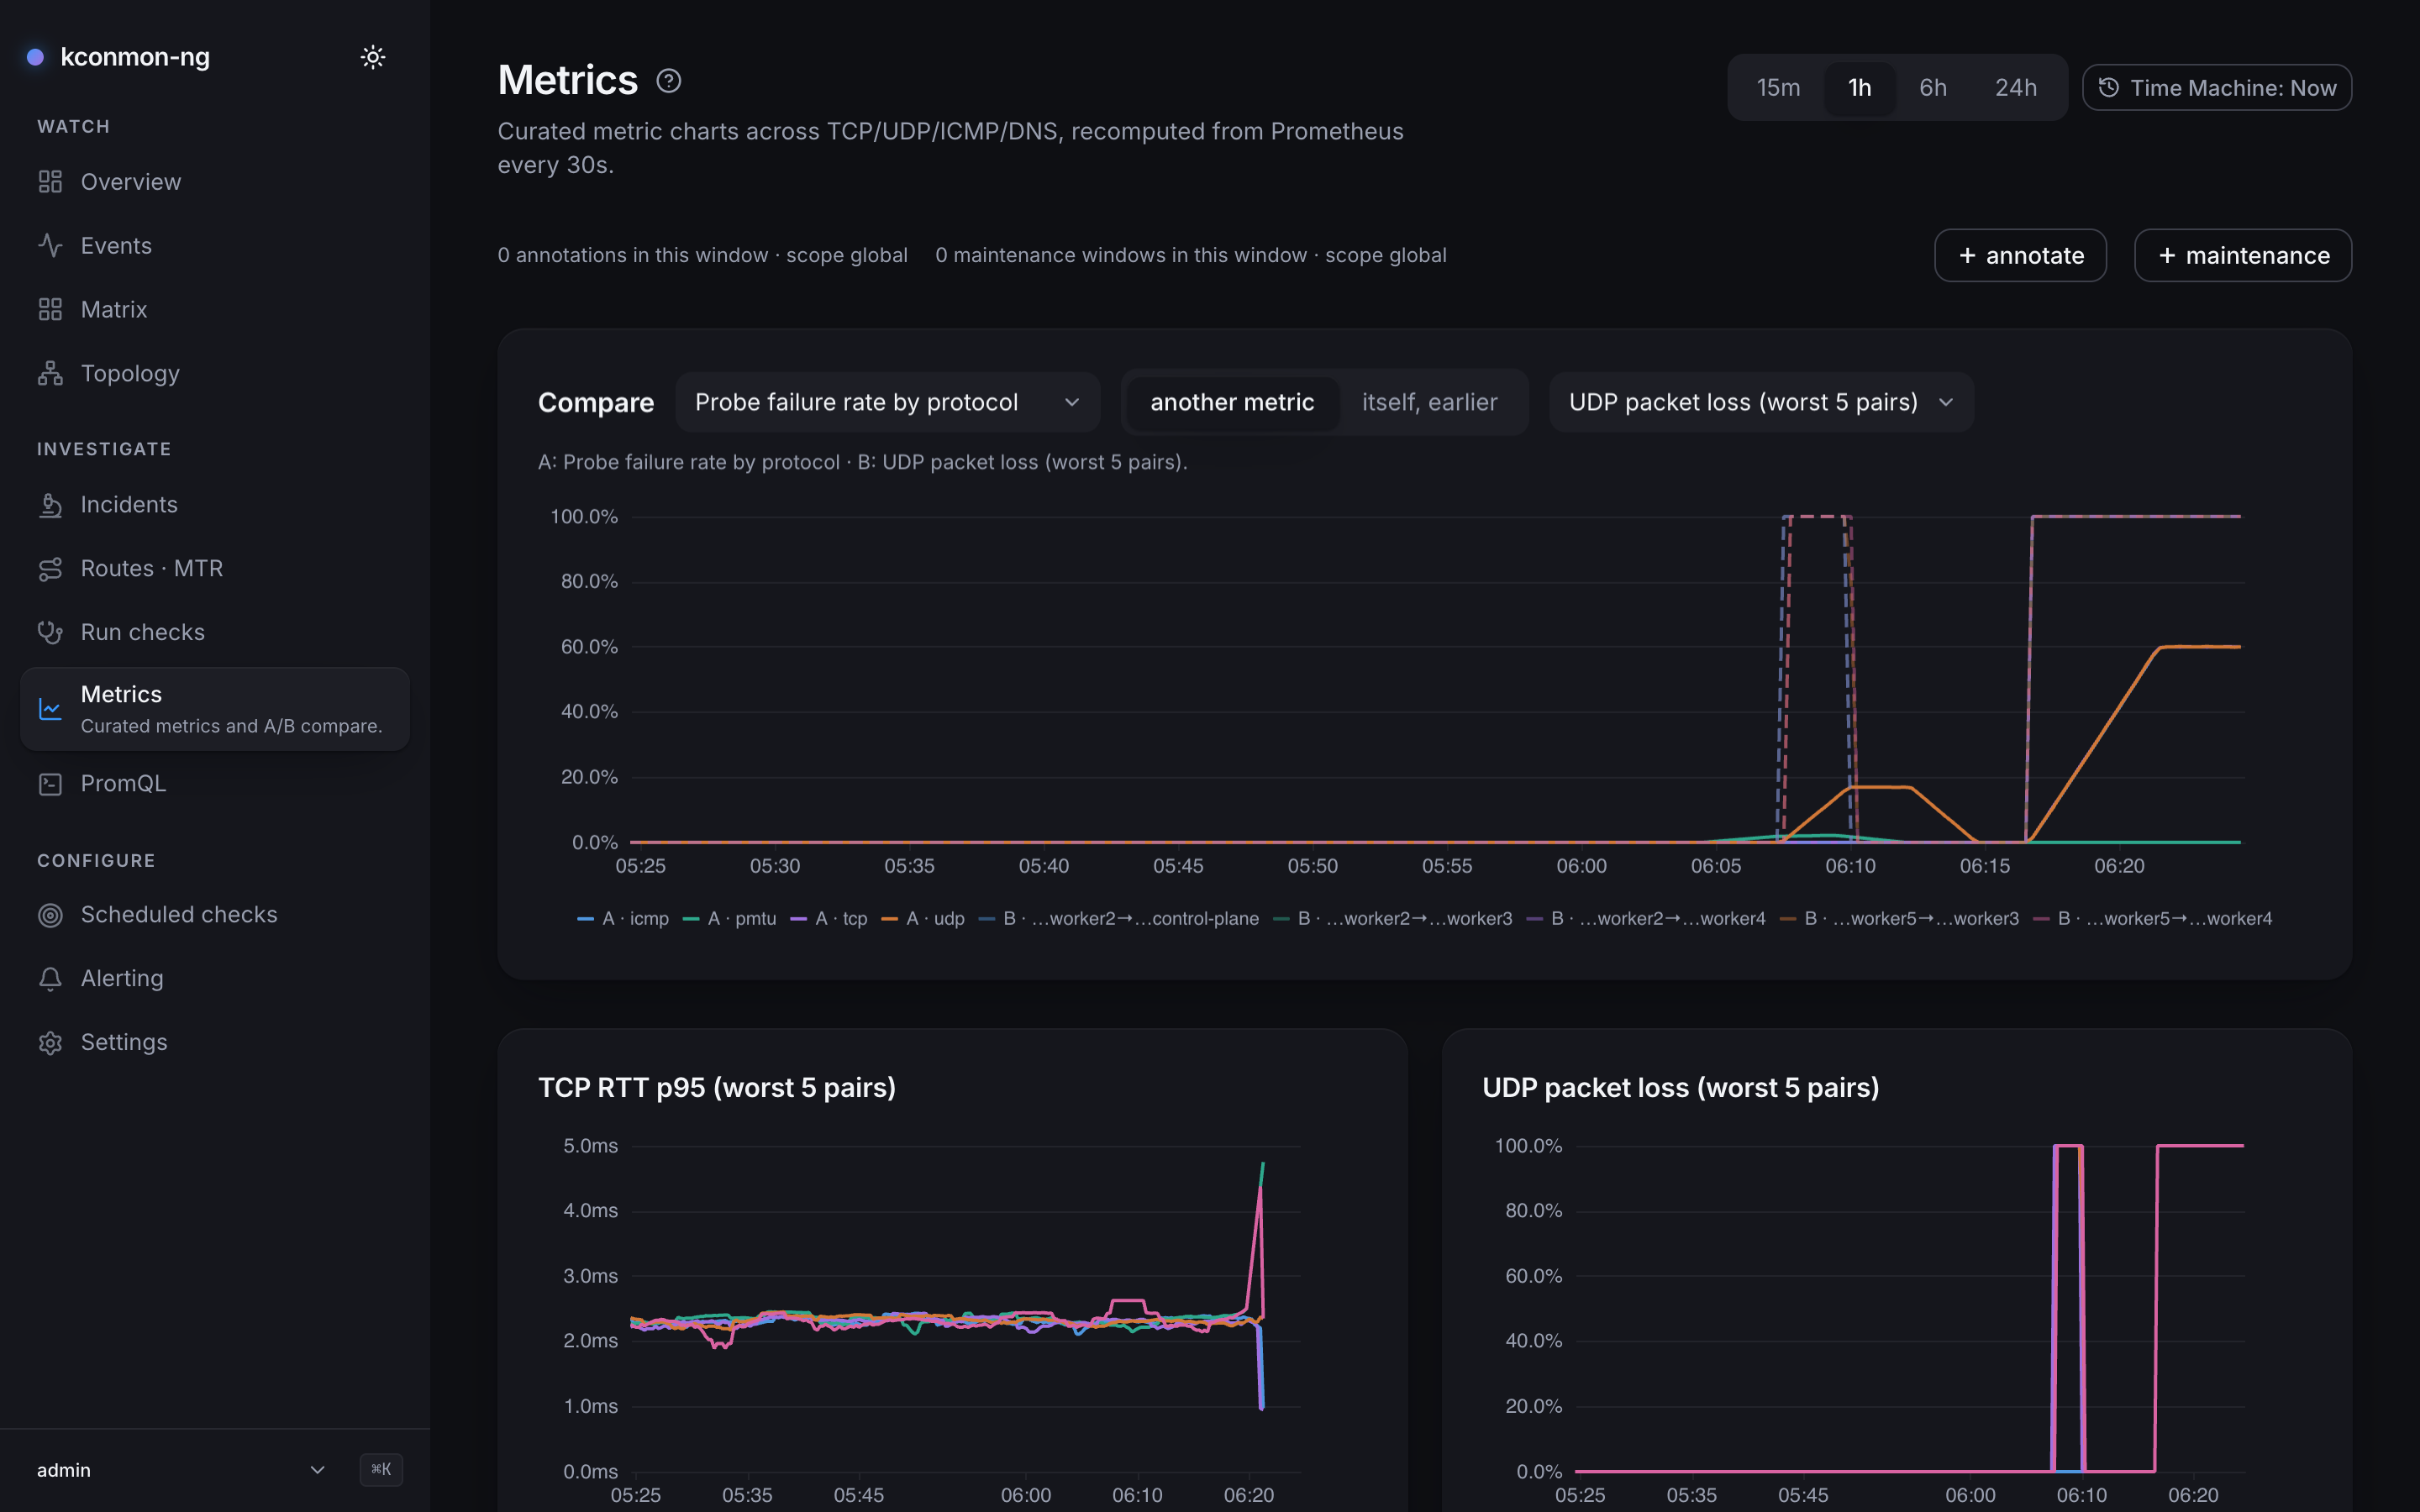
The five charts
- TCP RTT p95 (worst 5 pairs)
- UDP packet loss (worst 5 pairs)
- ICMP RTT p95 (worst 5 pairs)
- DNS resolution p95 by host
- Probe failure rate by protocol
Each is a fixed PromQL query over the exported kconmon_ng_* series; the exact expressions live in web/src/lib/curated-metrics.ts, and any of them can be copied onto the PromQL page and modified freely. An empty chart says so in words: "No series returned for this range — try a longer window above."
A Time range switch (15m / 1h / 6h / 24h) applies to every chart. Charts poll every 30 seconds through the console's guarded Prometheus proxy (POST /api/v1/promql/query_range), with the query step sized for roughly 240 points per series and never finer than 15 s. With the Time Machine engaged, the window ends at the viewed instant and the range is measured back from there. Time-axis ticks print HH:mm, and HH:mm:ss for a tick between whole minutes, so a short window does not repeat one label along the axis.
The synced cursor
Hover any chart and a vertical time cursor appears on all five at the same instant. The page is the sync group, so a spike on one metric can be eyeballed against its neighbours without lining up pixels by hand. The cursor carries a timestamp, never a pixel position: panels on this page do not share an x-domain (the compare leg below is shifted by hours or days), so each chart converts the instant with its own axis, and the cursor stays truthful across the shift. The same mechanic connects the Incidents timeline to its charts.
Compare
The Compare panel overlays a reference leg on metric A's axes:
- Compare A with: another metric (pick Metric A and Compare with metric) or itself, earlier (Compare with earlier:
1h/24h/7d). Self-comparison draws "A · now (solid)" against "A · {shift} earlier (dashed)". - Units are never silently mixed. Comparing a ratio against a seconds axis, the page labels the mismatch and tells you to read the reference leg's shape, not its height.
- An earlier leg with no data answers plainly: "No data {shift} ago — either Prometheus's retention stops short of it, or nothing was being probed yet." The console cannot tell those two causes apart, so it names both.
Annotations and maintenance windows
Two bars ride under the charts, scoped to the plotted window. This is the concept's home page; the other surfaces that show them link back here.
- + annotate drops a note at a moment or over a range ("Rolled the gateway"). Needs
annotations:write. Annotations appear interleaved in Events with a Note badge, as timeline rows in Incidents, and on the object pages' chart bars. - + maintenance declares a maintenance window: start, end, reason. Needs
maintenance:write. A declared window mutes alert noise attribution and annotates every chart it covers. A window declared on this page is global, so while it is open it also holds back every console alert webhook, cluster-wide, and the form says so. The full list, future windows included, is managed on Alerting, which also covers the webhook hold.
Both are create-and-delete surfaces: an annotation or window can be removed (delete asks to confirm), but there is no edit; fix a wrong one by deleting and re-creating it. Both need the database.
When the p95 charts go dark
Under the cardinality valve (agent.metrics.detail, chart 2.3.0 and later), counters-only drops the four per-pair histograms at scrape time. On this page that darkens TCP RTT p95 and ICMP RTT p95, while UDP packet loss (a gauge) and Probe failure rate (counters) keep drawing, and DNS resolution p95 survives too, because the DNS family is recorded per host and resolver, not per pair. Under zone-only every series naming a destination node is gone; the DNS, HTTP and external families remain. Details on the modes: Matrix.
Deep links
- Compare in Metrics from Incidents opens this page; the A/B slots stay bound to curated metrics, so choose the window here. The page says so rather than dropping half the promise.
- The command palette's Add an annotation… and Declare a maintenance window… actions land here.