Events
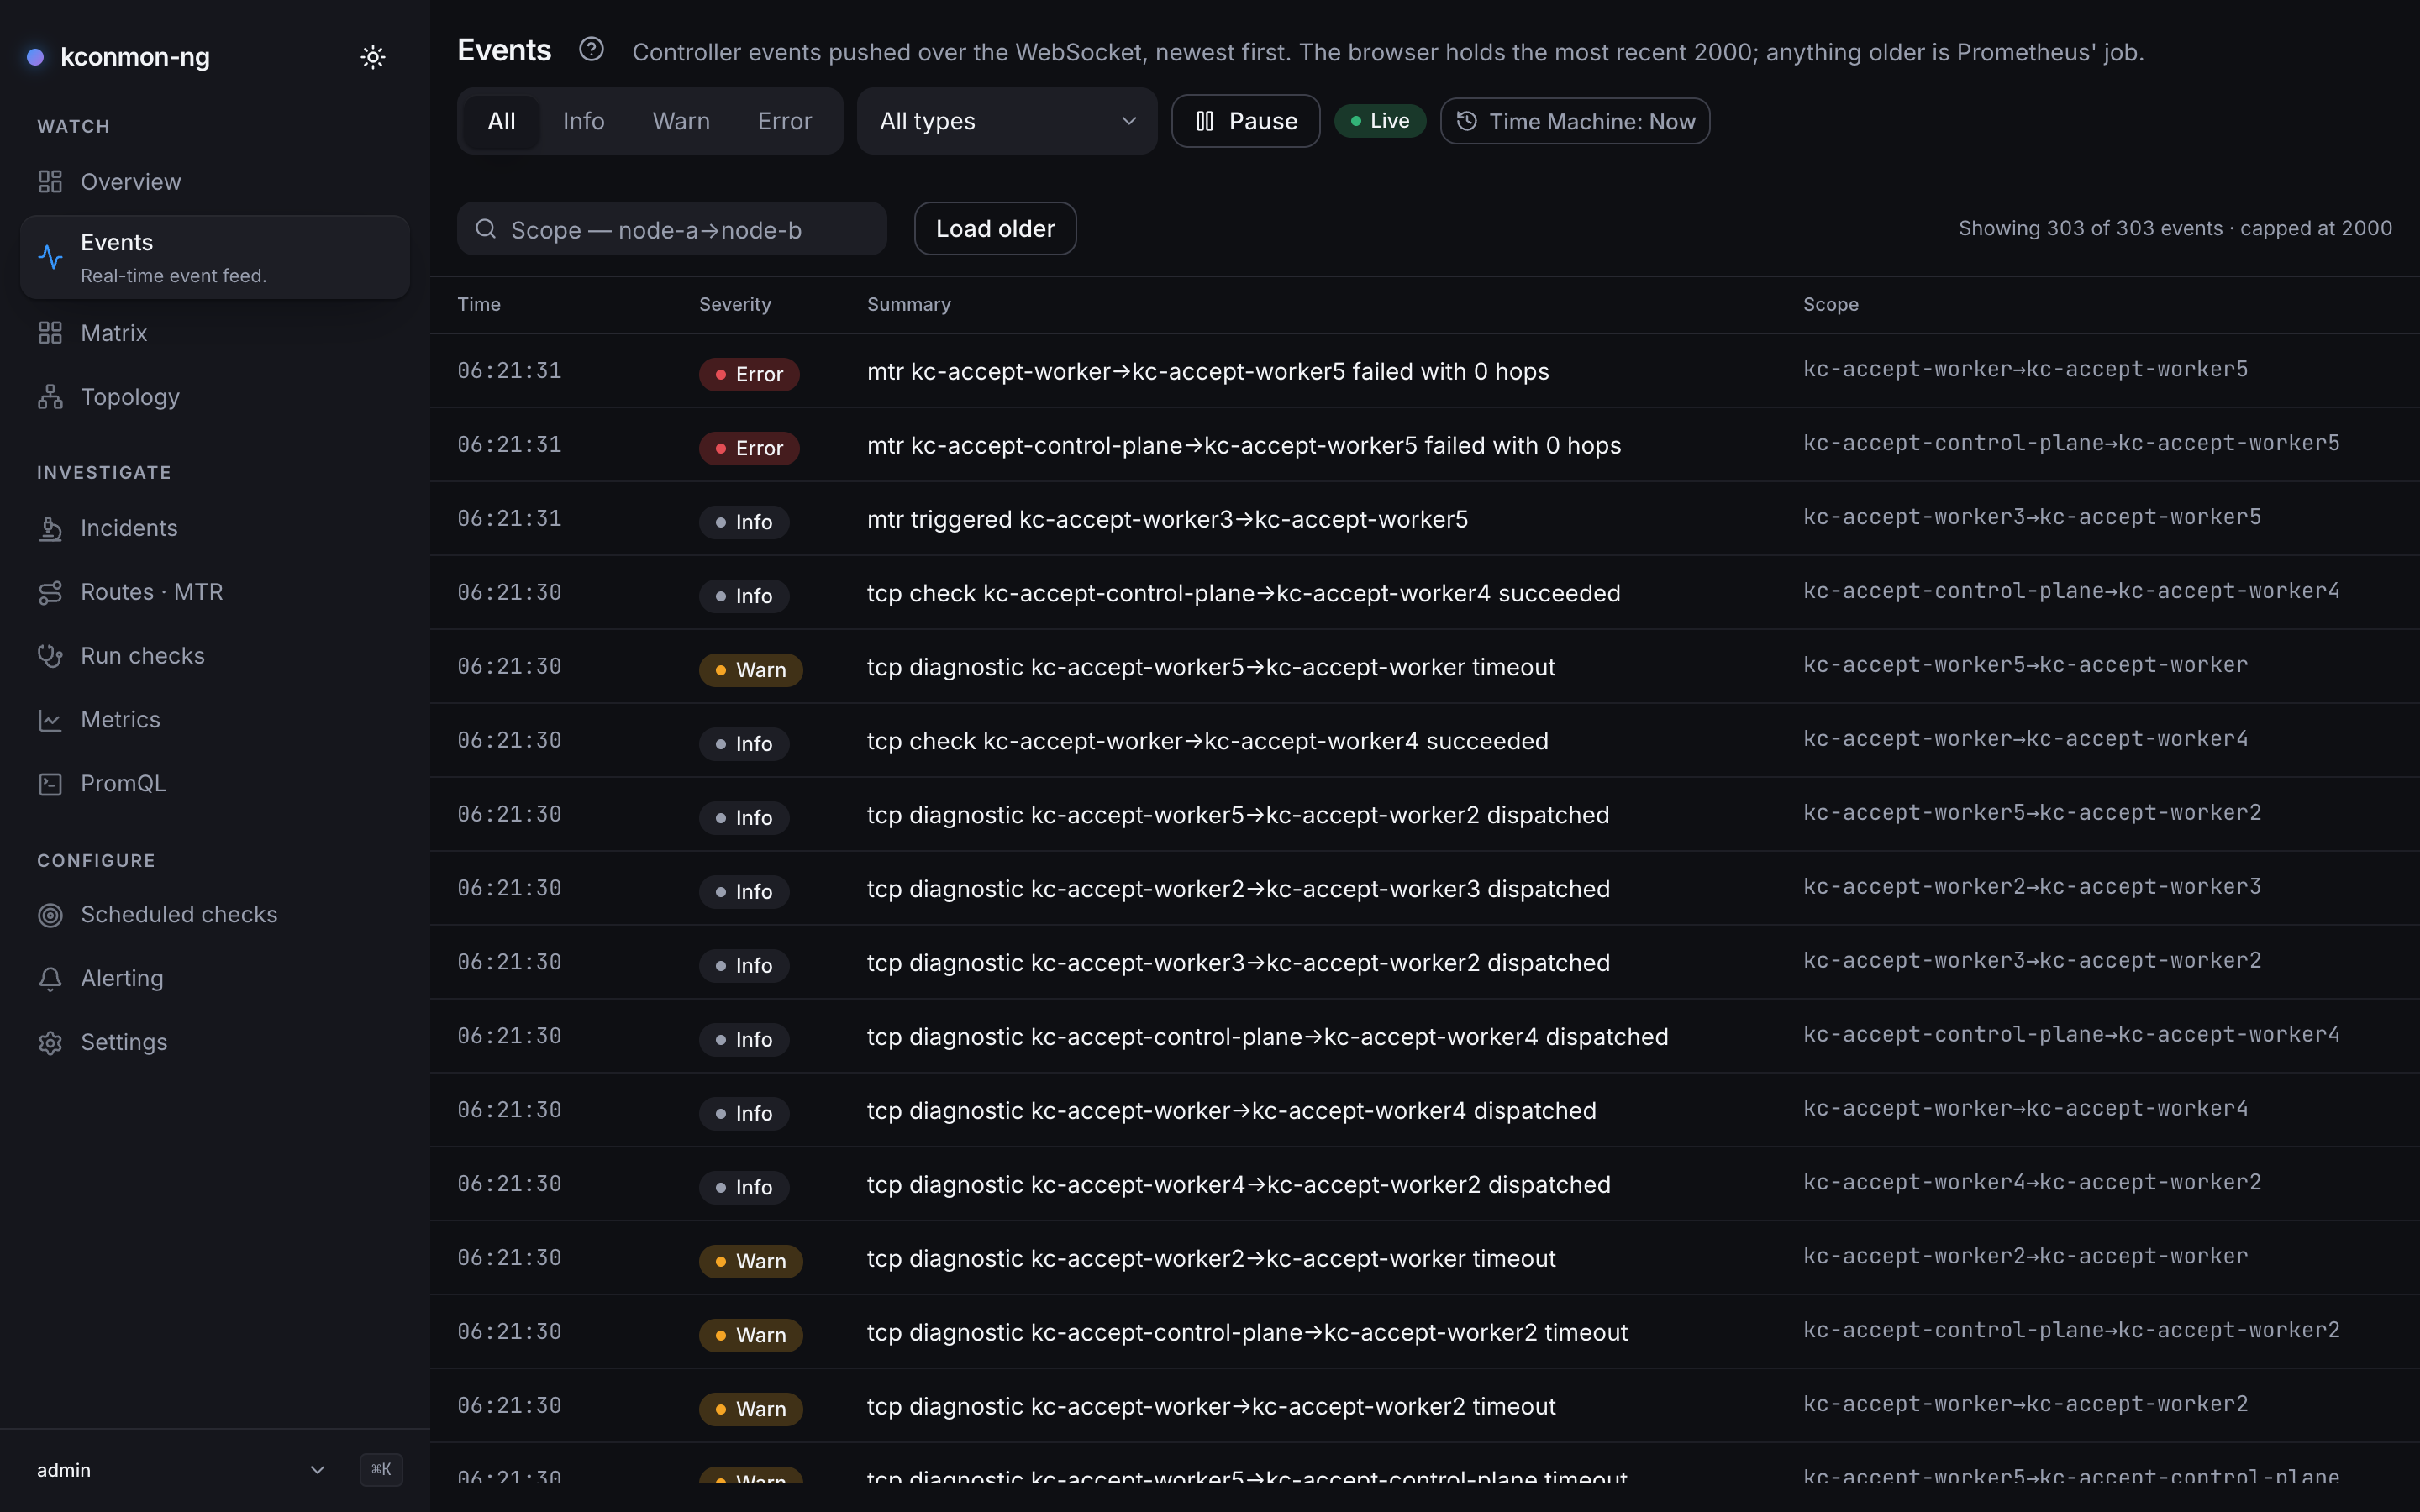
The controller's event feed, newest first: restarts, readiness flaps, check observations, on-demand traceroutes, in the order the controller saw them. When you need the raw record of what happened around 14:32, this is it.
How the feed is fed
Live, events are pushed over a WebSocket (topic live on ws(s)://<console-host>/ws); the header carries a Live badge while the stream is up and Delayed data when it is not (the badge's semantics are chrome-wide). The browser keeps the most recent 2 000 events in a ring. Anything older is served from event history (GET /api/v1/events), which exists only when the console has a database (Helm: database.existingSecret, see Enable the console).
The stream is sequenced. Every event carries a per-topic sequence number, so the tab can detect holes: a gap in the numbering means something went missing between the controller and this tab, and the feed says how many events may have been lost, with a "Why?" disclosure explaining the two causes (numbering holes, and frames a hidden tab dropped because the browser gave it nothing to render in). If the socket drops, the client reconnects with exponential backoff from 1 s up to 15 s and resubscribes with its last-seen sequence number, so the hub replays what the tab missed. That cursor is only honoured by the replica that issued it; after a console rollout the new replica's numbering starts fresh, the cursor is ignored rather than misapplied, and the gap is reported instead of papered over.
With the Time Machine engaged the live tail is off: the feed becomes scrollback ending at the viewed instant, and Load older walks back from there.
Reading the feed
Columns: Time, Severity, Summary, Scope. There is no Type column, because the summary opens with the type's own words. Severities are Info, Warn, Error; an unknown wire value still renders raw, since the feed never hides an event it cannot classify.
Operator annotations are interleaved at their own timestamp with a Note badge (ranged ones read Annotation (span)). They are not events and the event filters do not touch them. The severity and Note badges keep their words at every width, phones included.
The Type filter offers, besides All types:
- Topology changed: a node or agent joined, left, or changed readiness.
- Check observed: a scheduled or continuous check produced a result worth reporting.
- MTR triggered: an on-demand traceroute was dispatched, from a run or from
kubectl kconmon mtr(see Routes · MTR). Reactive traces do not appear here. - MTR completed: that trace finished, with its hops.
- Diagnostic progress: a run started from Run checks reported progress.
Filtering: Severity and Type selects (both default All), and Scope contains, a case-insensitive substring match on the event's scope. Pair input is normalised, so node-a->node-b, node-a => node-b and node-a > node-b all match the same pair. Clear filters resets all three.
Pause buffers arrivals, and the button becomes Resume with the count ("Resume (3 buffered)"), which drains the buffer into the feed. While paused, the badge reads "Paused · socket live" or "Paused · socket down", so you know whether the feed you are about to resume is still there. The counter line reads "Showing {shown} of {held} events · capped at 2000". The feed fills the window below the toolbar at every width, so on a phone the page scrolls once rather than a list inside a page.
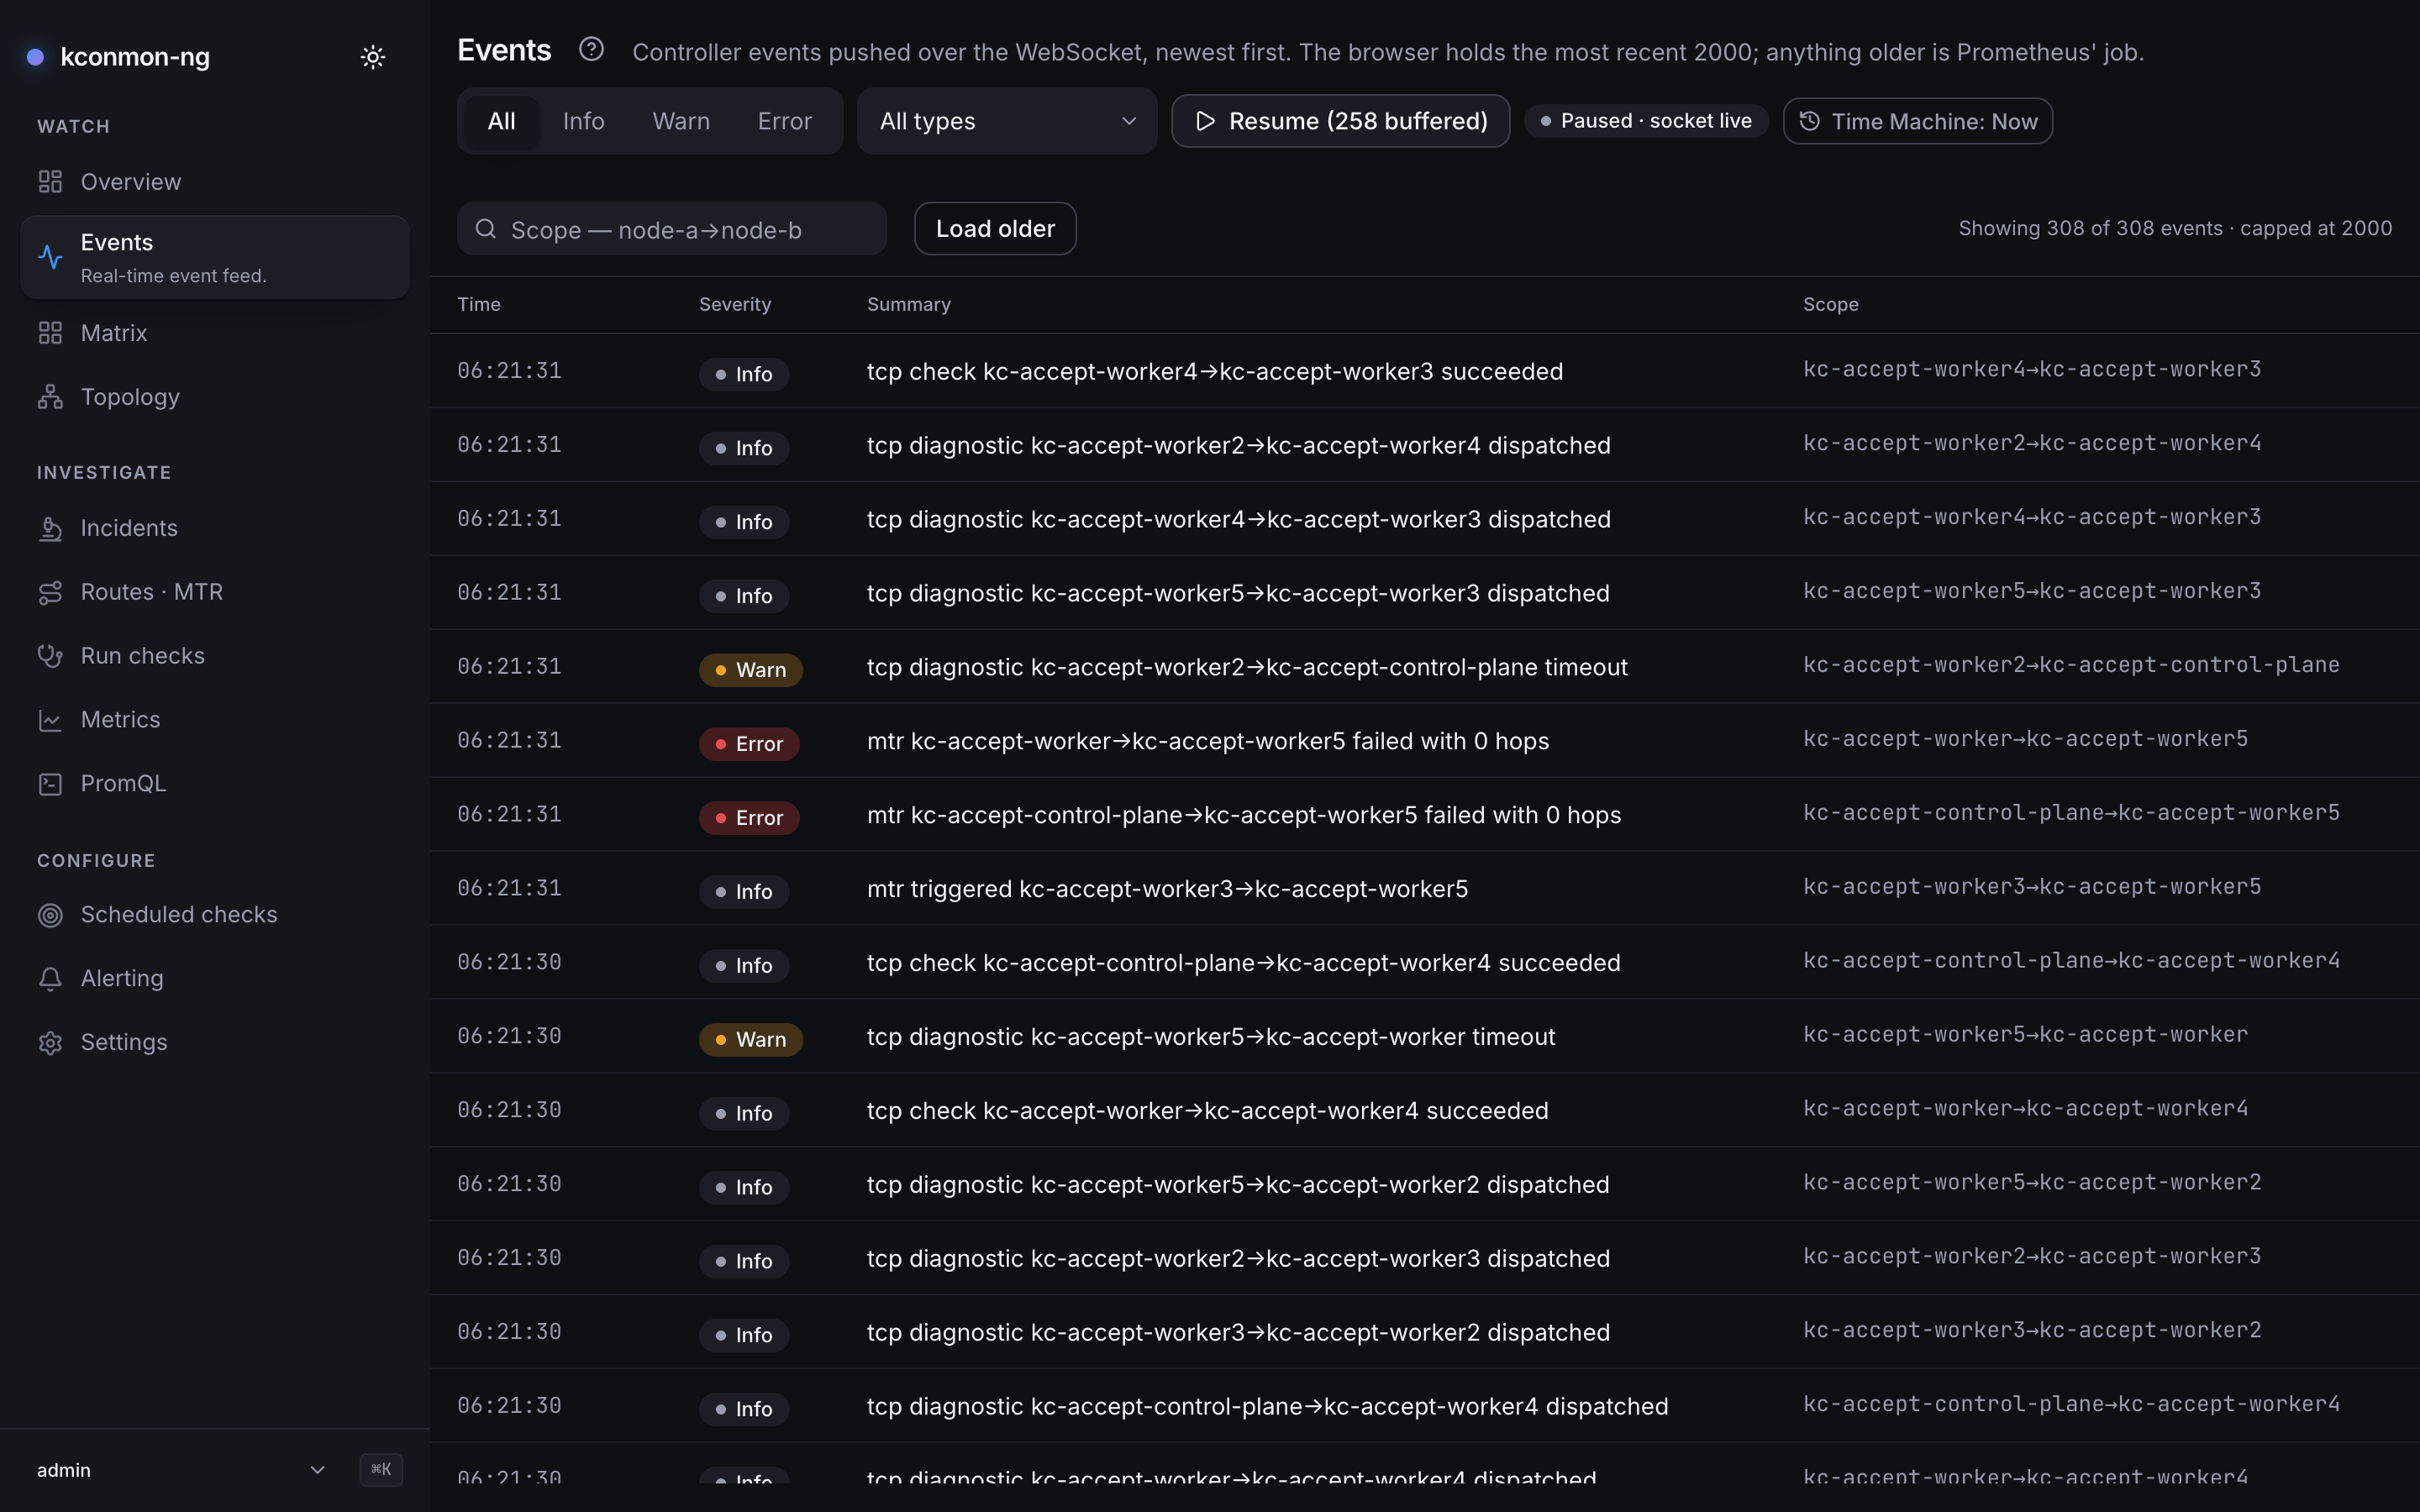
Load older pages history back through GET /api/v1/events. A page that fails shows the server's reason and leaves Load older enabled, so the next press retries the same page. That includes the first page: when it fails, such as with the 503 of a console without event history, the notice carries Retry too. When the 2 000-event ring is already full it refuses instead of spending a round trip on rows it would have to drop: "The buffer is full at {cap} events. Older ones cannot be added without dropping newer ones; narrow the filters or reload to start a fresh buffer."
When the feed degrades
Three distinct cards, three distinct fixes:
"This replica is not receiving the controller event stream." The feed is not broken, it is unfed: no events will arrive here while that holds, Matrix and Topology fall back to 15 s polling, and the feed resumes on its own within 15 s of the stream coming back. What to check, in order:
controller.events.enabledin the Helm values: the domain event stream is off by default.- Whether the controller actually restarted after you flipped it. Before chart 2.0.3 a values change updated the ConfigMap under a running controller that reads it once at startup, so the stream stayed configured-but-never-started and nothing anywhere logged an error; 2.0.3 added a
checksum/configannotation so a values change rolls the pods. On an older chart,kubectl rollout restartthe controller yourself. - Replica topology: the stream is served by the controller leader only, and with several console replicas each connects independently, so one replica can be fed while another is not.
"The live topic was rejected." The WebSocket subscription itself was refused: topics are authorization-gated server-side, and a session whose role lacks the matching read permission cannot subscribe (events:read alone does not grant the topology or matrix topics either, and a run's run:{id} topic needs runs:read, like GET /api/v1/runs/{id}). The built-in roles hold all of them. This is a permissions conversation, not a networking one.
"Event history is unavailable." The history half failed, or the console could not read its own configuration (GET /api/v1/config), so it cannot tell whether event history exists; the card then says "Could not read the console configuration, so event history was not requested: {error}". Either way the live half keeps working off the socket. A console with no database shows no such card: it offers no Load older, and the feed holds only what arrived live.
Getting here
open Events on the Overview lands here, and event rows appear as timeline entries in Incidents whenever their scope matches.