Topology
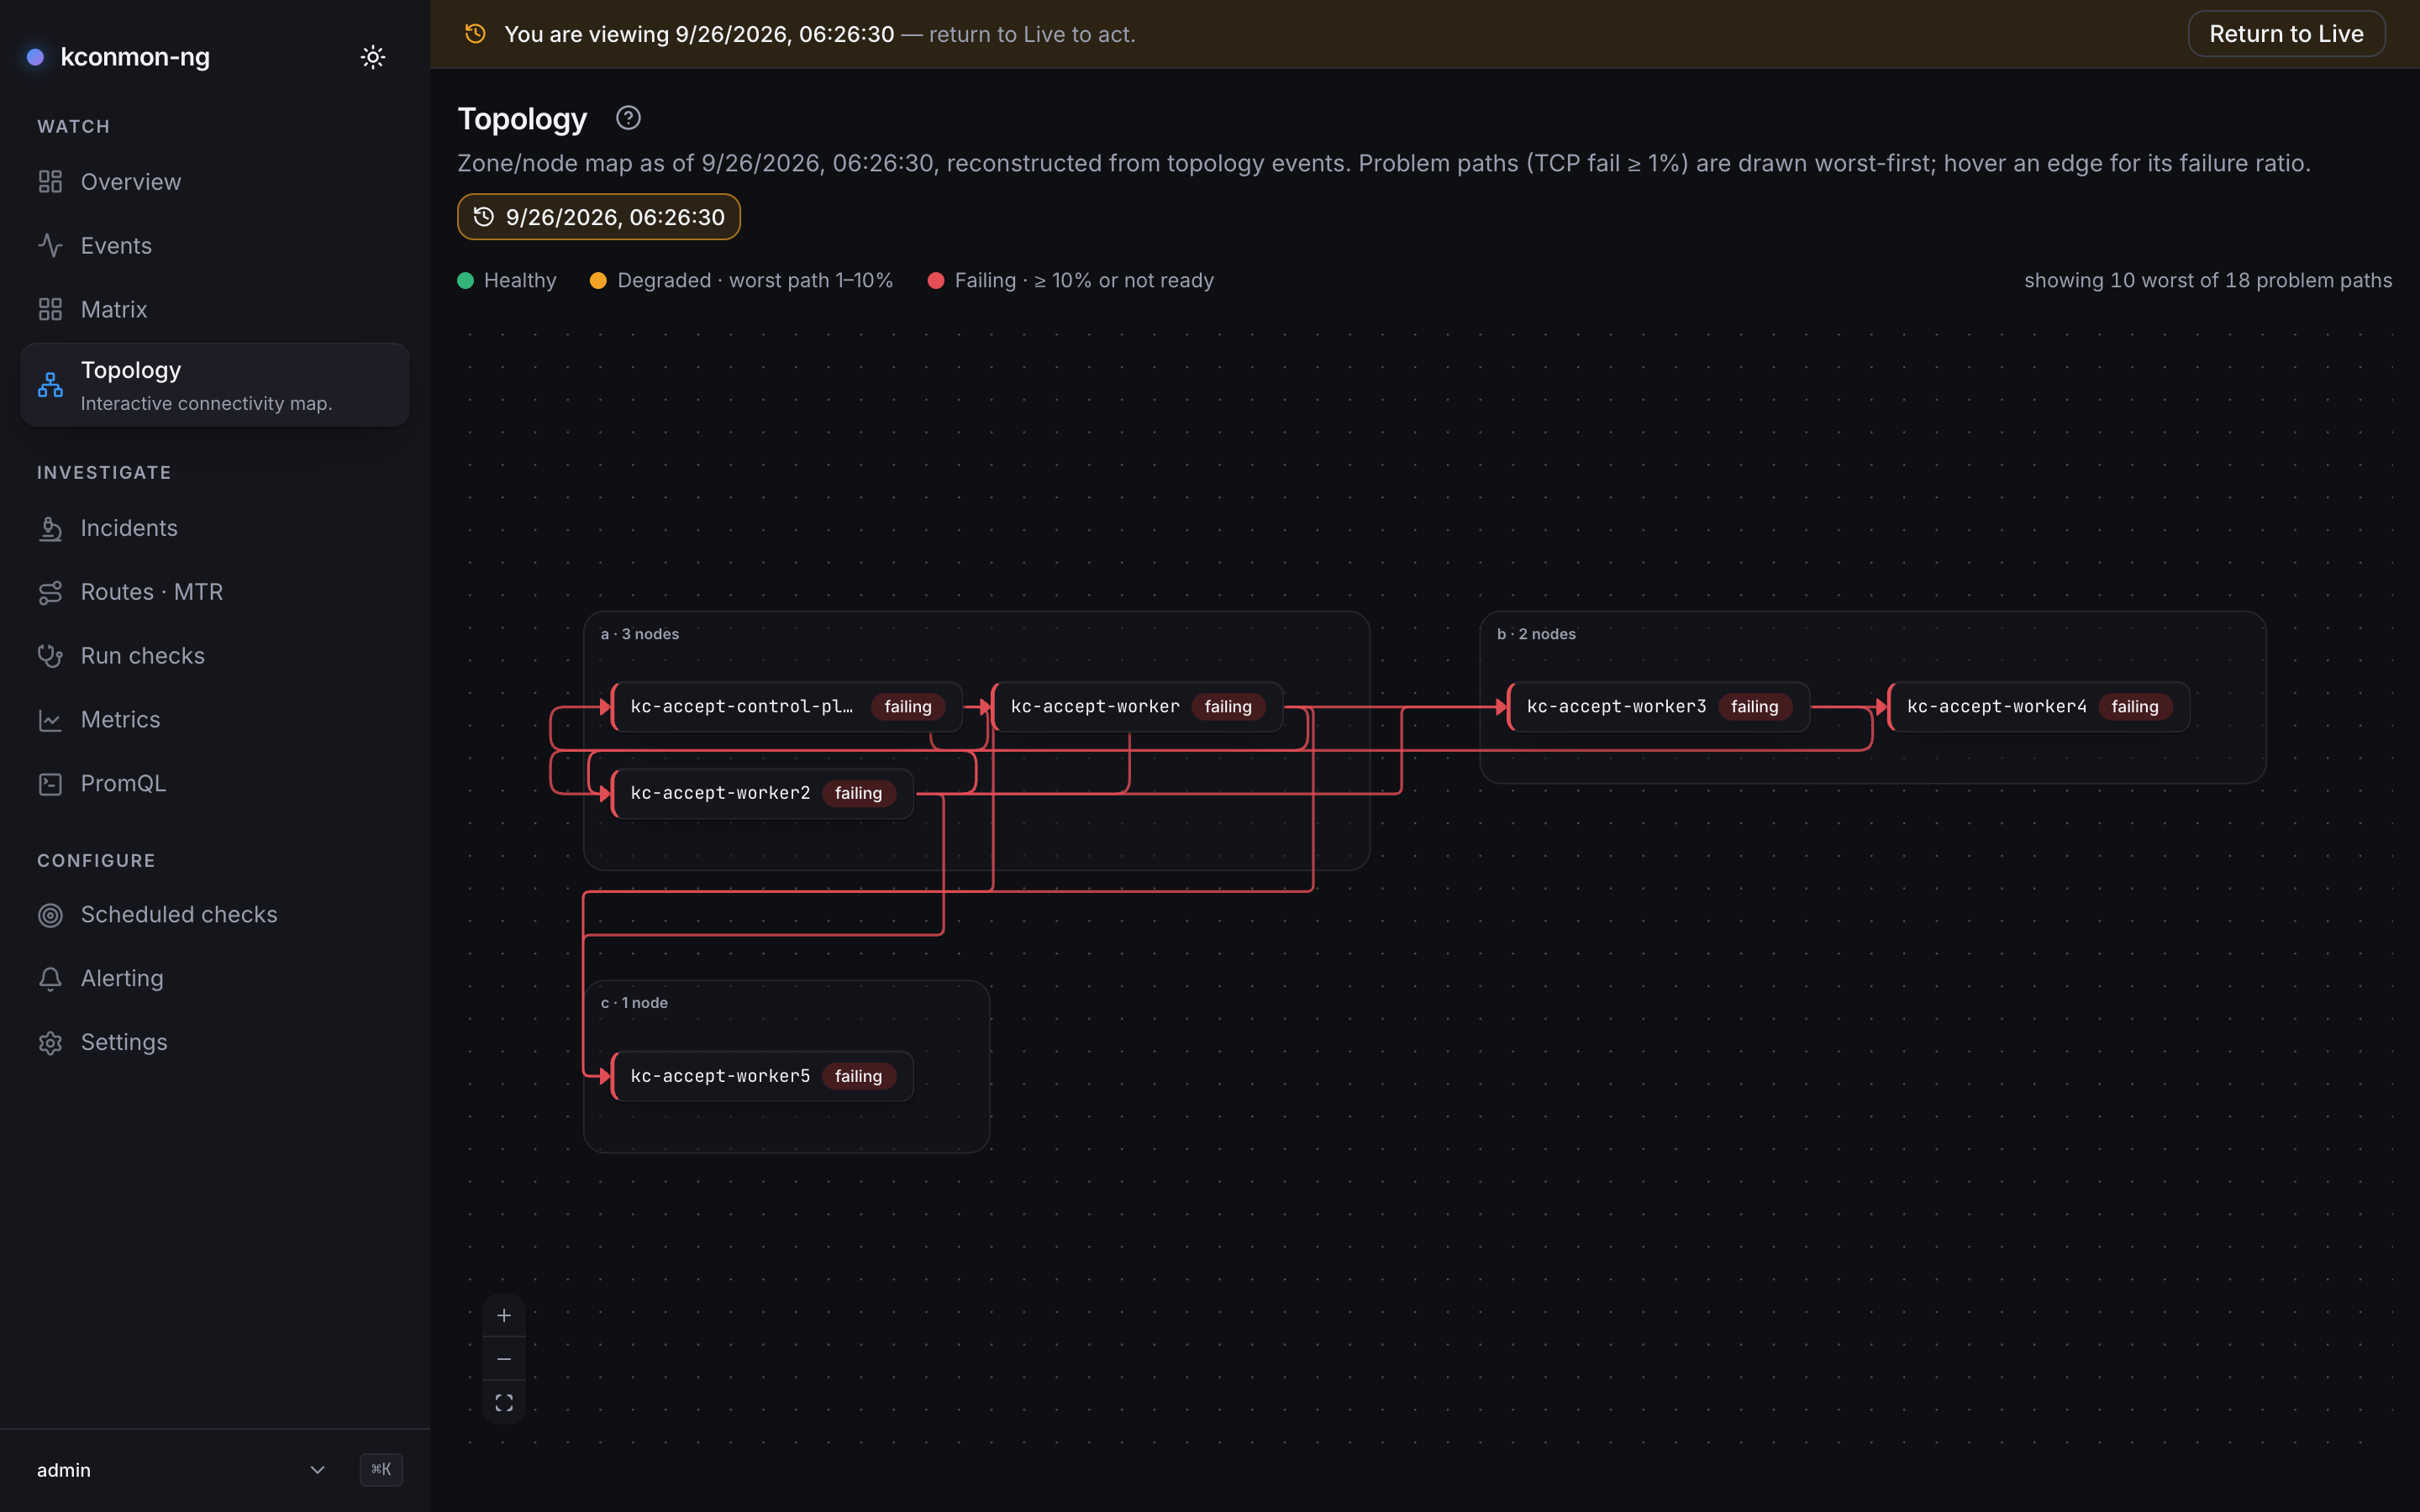
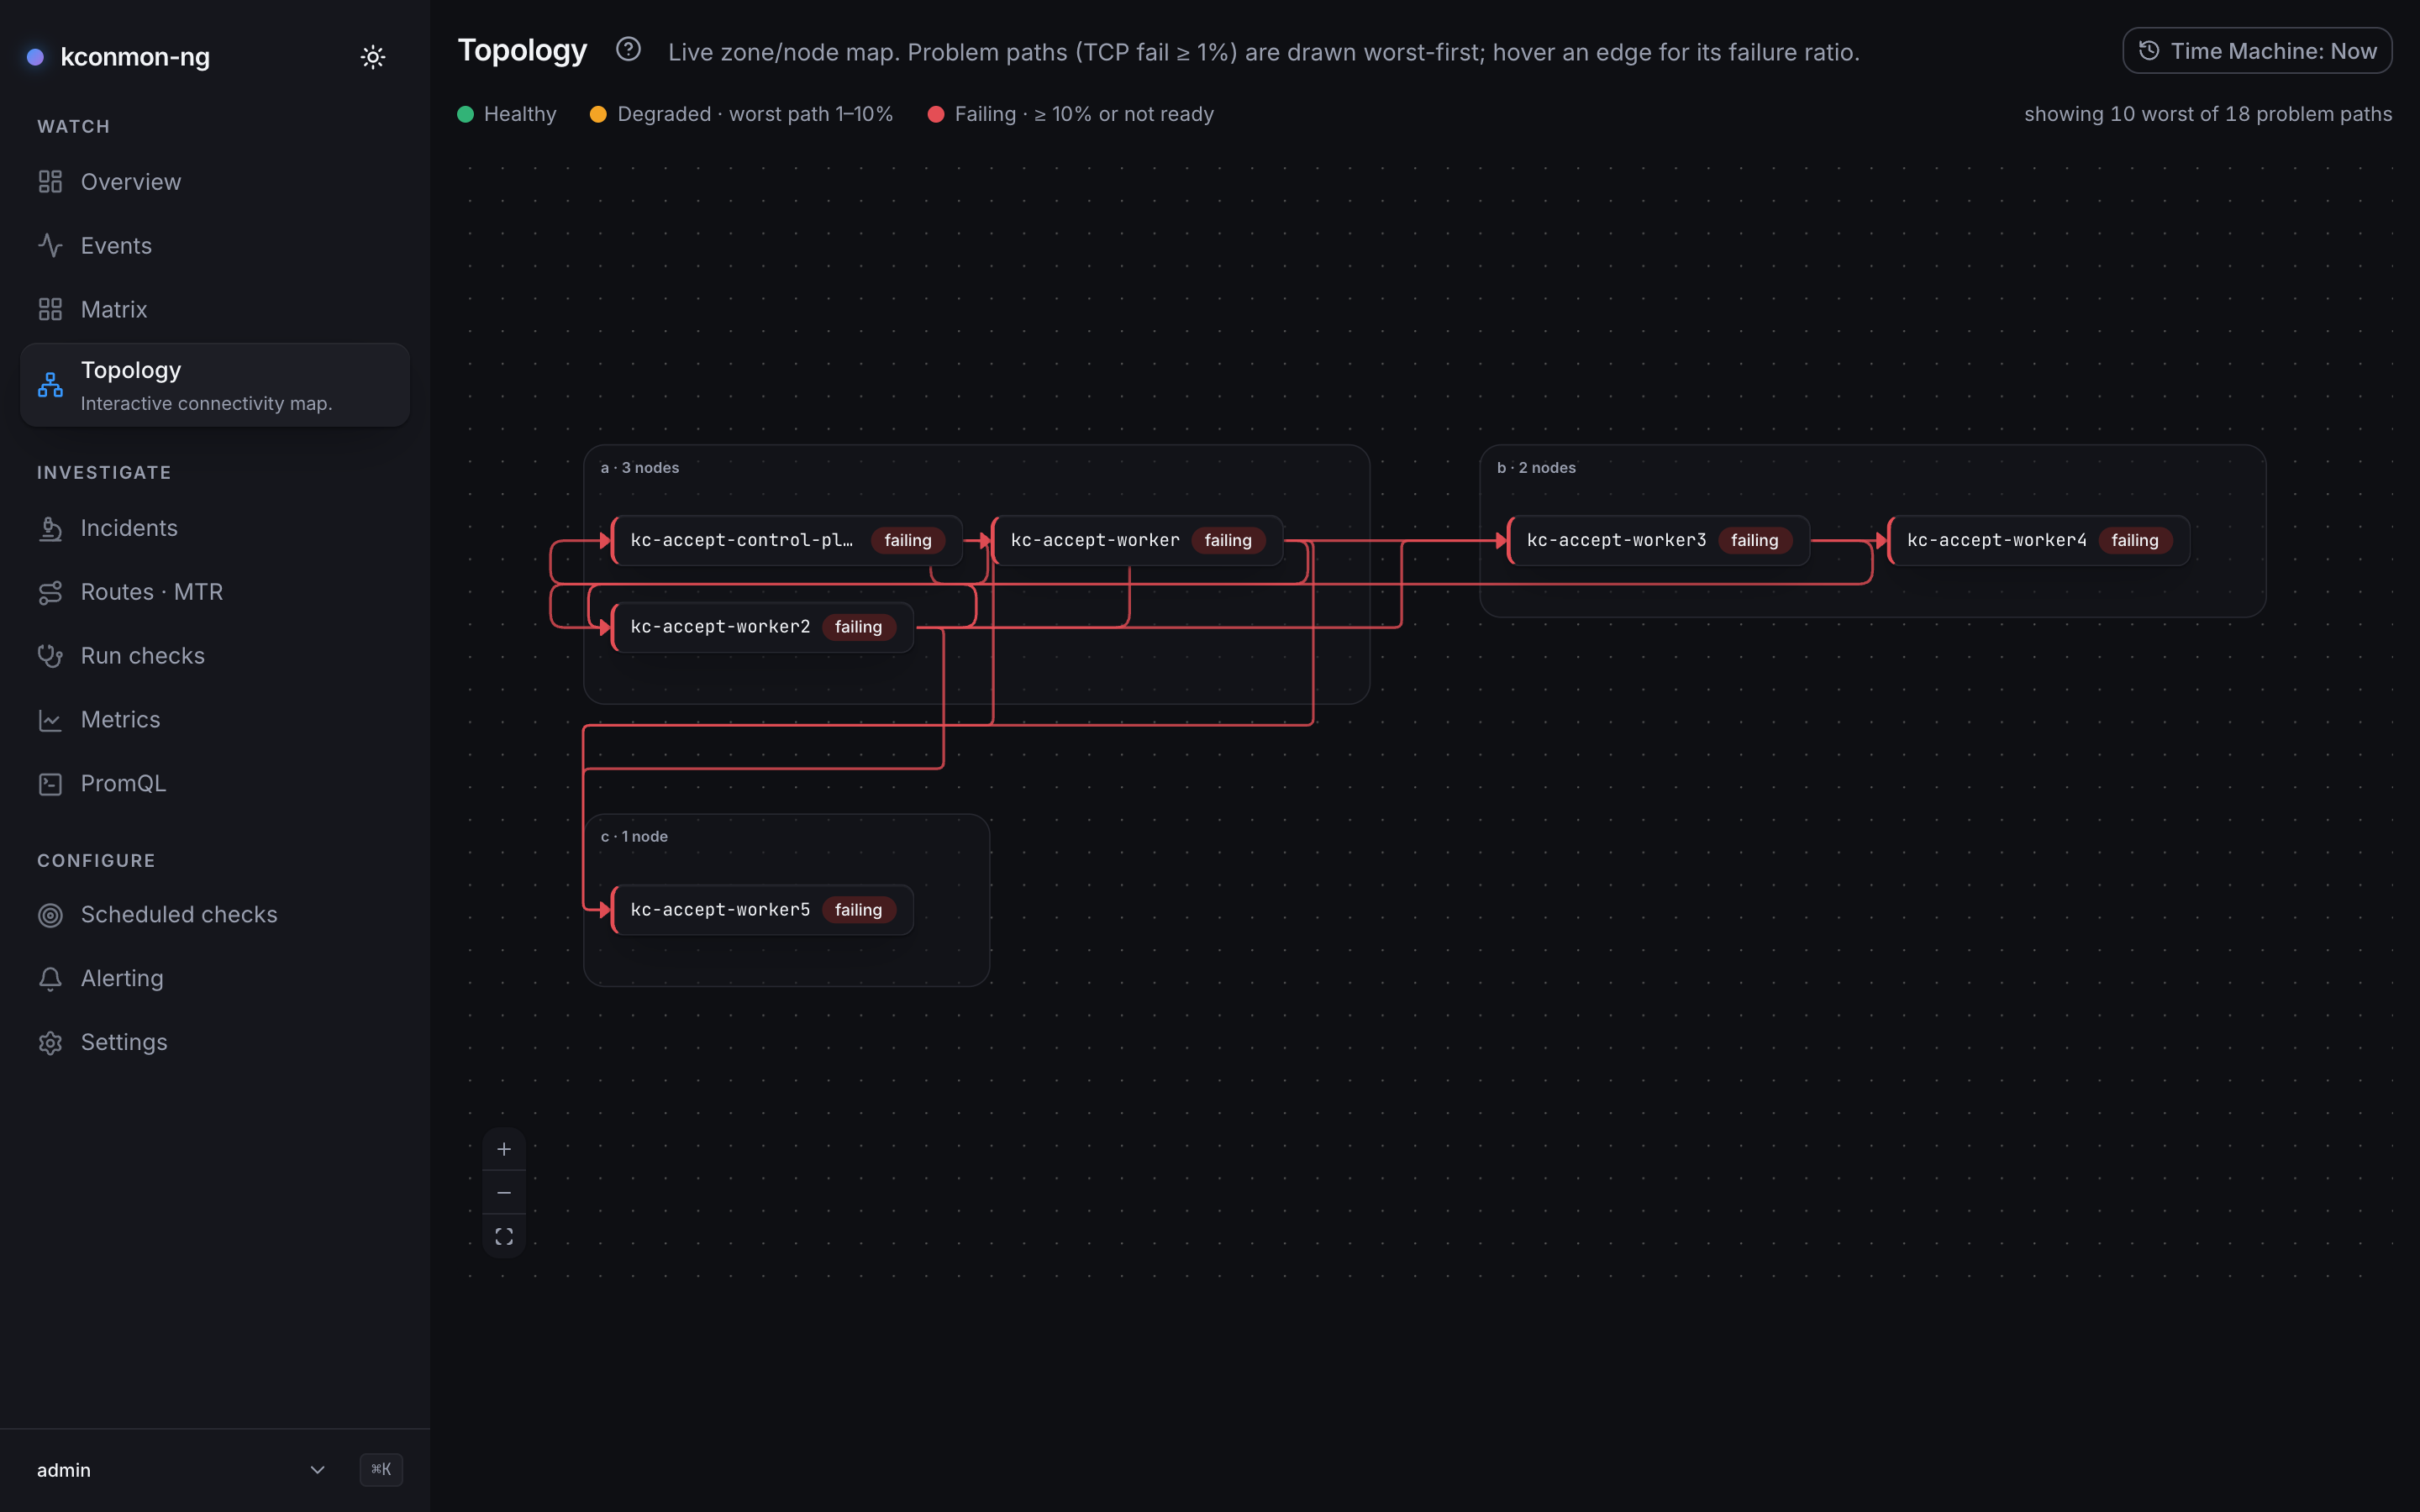
An interactive zone and node map. Nodes are boxes grouped into zone lanes; problem paths are drawn as edges between them, worst first. During a zonal incident the tell is visual: cross-zone edges clustering on one lane.
Nodes
Node colour comes from the probe matrix, using the same tiers as the Matrix legend: Healthy, Degraded · worst path 1–10%, Failing · ≥ 10% or not ready. A not-ready node carries a "not ready" badge. Selecting a node and pressing Enter (or clicking it) opens its node page, carrying ?at= when the Time Machine is engaged.
Each zone is one lane, headed "{zone} · {count} nodes", with the zone name printed exactly as the node label or the agent reports it, case included. A big zone wraps into a grid rather than a single column: the column count grows roughly as the square root of the node count and is capped at four, so a zone stays a shape a pane can hold instead of a tall strip the auto-fit has to shrink into illegibility. Zones are laid out to fit the pane. On a wide screen one or two zones sit side by side, and three or more pack into two or three columns, whichever count gives the map a shape closest to the pane's, so zones with many nodes wrap sooner. On a portrait screen, such as a phone held upright, a single column is one of the choices too, so the zones may stack one above another, which draws the map larger than a wide packing squeezed into a tall pane. Nodes whose zone label is absent gather in a lane named no zone reported: exactly what is true, and also the state you get on a cluster whose nodes lack the topology.kubernetes.io/zone label.
Map controls: Zoom in, Zoom out, Fit the whole map. The map is read-only; nodes are not draggable. On a phone the canvas is sized to end on screen, so the controls in its corner stay within reach.
External agents on the map
An agent registered from outside the cluster (a bare host through the gateway) has no Kubernetes node, so since 2.4.0 the map merges it in from the agent list: it sits in the lane of the zone it registered with, takes its colour from the matrix like any other node, and wears a neutral external badge, an identity marker and never a health tier. Readiness is unknown by construction, since there is no node object to be ready, and the box says so to a screen reader: "{node}, {zone}, {health}, external agent, readiness unknown". The map's provenance stays the Kubernetes node view, so a bare host never triggers the "map built from registered agents" notice described below. Under the Time Machine the badge comes from the labels recorded on topology events and snapshots, which a controller older than 2.4.0 did not record: history from before that upgrade shows the host as a plain node.
Edges
Edges are drawn only for problem paths (TCP fail ≥ 1%), and there is a budget: at most 10 edges, worst first. The caption counts what the budget hid ("showing {shown} worst of {total} problem paths"), or simply "3 problem paths", or "no problem paths right now". Each edge label names its vector: a plain percentage is a failure ratio, "{pct} loss" is packet loss, and hovering an edge shows its ratio.
One edge per ordered pair, keeping the worst reading. If the matrix somehow carries two cells for the same A→B, drawing both would double-count one path in the caption and collide two drawn edges under one identity, so the map arbitrates worst-of, the same rule every other severity read in the console applies.
Degraded and stale states
All the map's non-happy paths, in one place:
- "This map is no longer refreshing": the last refresh did not come back. What is on screen is the node set that loaded before it, and the console keeps retrying on its own. Distinct from "Topology is unavailable" on purpose: claiming nothing over a map that is visibly on screen would be wrong, what the page has is something older.
- "Your browser reports no connection": the request never left the browser. It goes out by itself once the connection is back.
- No Kubernetes node view at all: the map is drawn from registered agents and the zones they registered with, a notice says so, node colour still works, and readiness is unknown.
- Live empty state: "No nodes reported by the controller yet" points at the agent DaemonSet.
- Historical bounds: see below.
The map under the Time Machine
Live, the node set refreshes every 15 seconds. Engaged, the map switches mechanism entirely: it is reconstructed from stored topology events, folded up to the viewed instant.
Events only record what changed, so the fold starts from a snapshot of the whole topology that the console stores when it connects to the controller's event stream and every hour after that, then replays the events since. Instants from before a console's first snapshot, which includes everything recorded before 2.4.0, get the events alone: the map then shows only the nodes whose agents registered, moved or left inside the retained window, and misses the ones that sat still.
Why events rather than Prometheus? Prometheus can answer "what were the series at 03:12", but node identity, readiness transitions and agent registrations are not series: they are facts the controller reported as they happened. The event log is the only record with them in order, so the fold replays it. The trade is stated by the API itself: historical topology needs the database (GET /api/v1/topology?at= answers 503 without one, naming database.dsnFile, Helm: database.existingSecret), and an instant older than what retention kept answers 422, telling you to pick a later time or raise database.retentionDays (the same key in the console config and in Helm).
The reconstruction states its own bounds in place: an instant past the kept window ("This reconstruction is incomplete"), events that name no node ("Nothing to reconstruct at this time"), or simply no nodes at that time.