Checks, runs and schedules
Five words do the work in kconmon-ng, and they are close enough to blur. A checker is a prober built into every agent, running continuously against the peer mesh. A check is a stored definition of a probe you declared in the Console, and a target is the named external destination a check can point at. A schedule decides when a check executes; a run is one recorded execution with a status and results.
Checks
Two layers, configured in two places:
- Built-in checkers live in the agents and are configured through Helm
(
config.checkers.*): TCP, UDP and ICMP run out of the box on a 5s interval against every peer, the path MTU probe once a minute, and DNS on a 5s interval from every node; HTTP is opt-in because it needs URLs only you know; MTR fires reactively when a TCP, UDP or ICMP probe fails. They need no database and no Console; this is the measurement core described in Architecture. - Check definitions are Console objects (stored in PostgreSQL, managed on
the Scheduled checks page or via
/api/v1/checks). A definition says which agents probe (all,per-zone, or the defaultone-per-zone), what they probe (a cluster node, a stored target, or an ad-hoc address), with which check type and parameters.
A guard bounds what one definition may fan out to: at most 400 projected series. The number is not arbitrary: it is calibrated as the worst run one source should be allowed to own, 400 pairs from a single source agent over 24 hours, and the same figure feeds the per-run deadline and the stuck-run sweep, so the limit, the deadline and the reaper all agree about what "too big" and "too long" mean. The same function answers the UI's preview, so the number you see is the number that is enforced.
Targets (/api/v1/targets, the external targets
scenario) name destinations that are not
fleet peers (a host or a url), so that metrics and events can carry a
stable operator-chosen name instead of an address. Probing them additionally
requires the agent-side external checker and its CIDR allowlist
(config.checkers.external).
Runs
A run is one execution. Its lifecycle is short and fully enumerable:
- created: the definition is expanded into sources × destinations, bounded to 400 pairs, before anything is dispatched.
- running: pairs are dispatched to the source agents, each pair under its own timeout. A source agent that is down or slow fails its pairs; it cannot hang the run.
- terminal: one of
succeeded,failed,partialorcancelled.
The verdict rule: a pair counts as OK when its latest sample succeeded
(the same rule the run detail page uses to collapse samples into one row per
pair, so the history list and the detail view can never disagree). All pairs
OK means succeeded, all failed means failed, a mix means partial.
cancelled covers an operator's cancel and one more case: a run orphaned
mid-flight, say by a console pod dying, is force-finished by a background
sweep that checks every minute and judges each run against its own declared
duration and fan-out. Nothing hangs forever, and nothing sits at "0 of 1 ok"
for a day.
Runs come from three places:
- On demand from the Run checks page (or
POST /api/v1/runs): probe a pair right now, mid-incident, with a permalink to the result. - From a schedule, when the scheduler fires a due check definition.
- From the terminal:
kubectl kconmon check node-1 node-2 --type udpdrives the controller's diagnostics endpoint directly, same probes, no Console required.
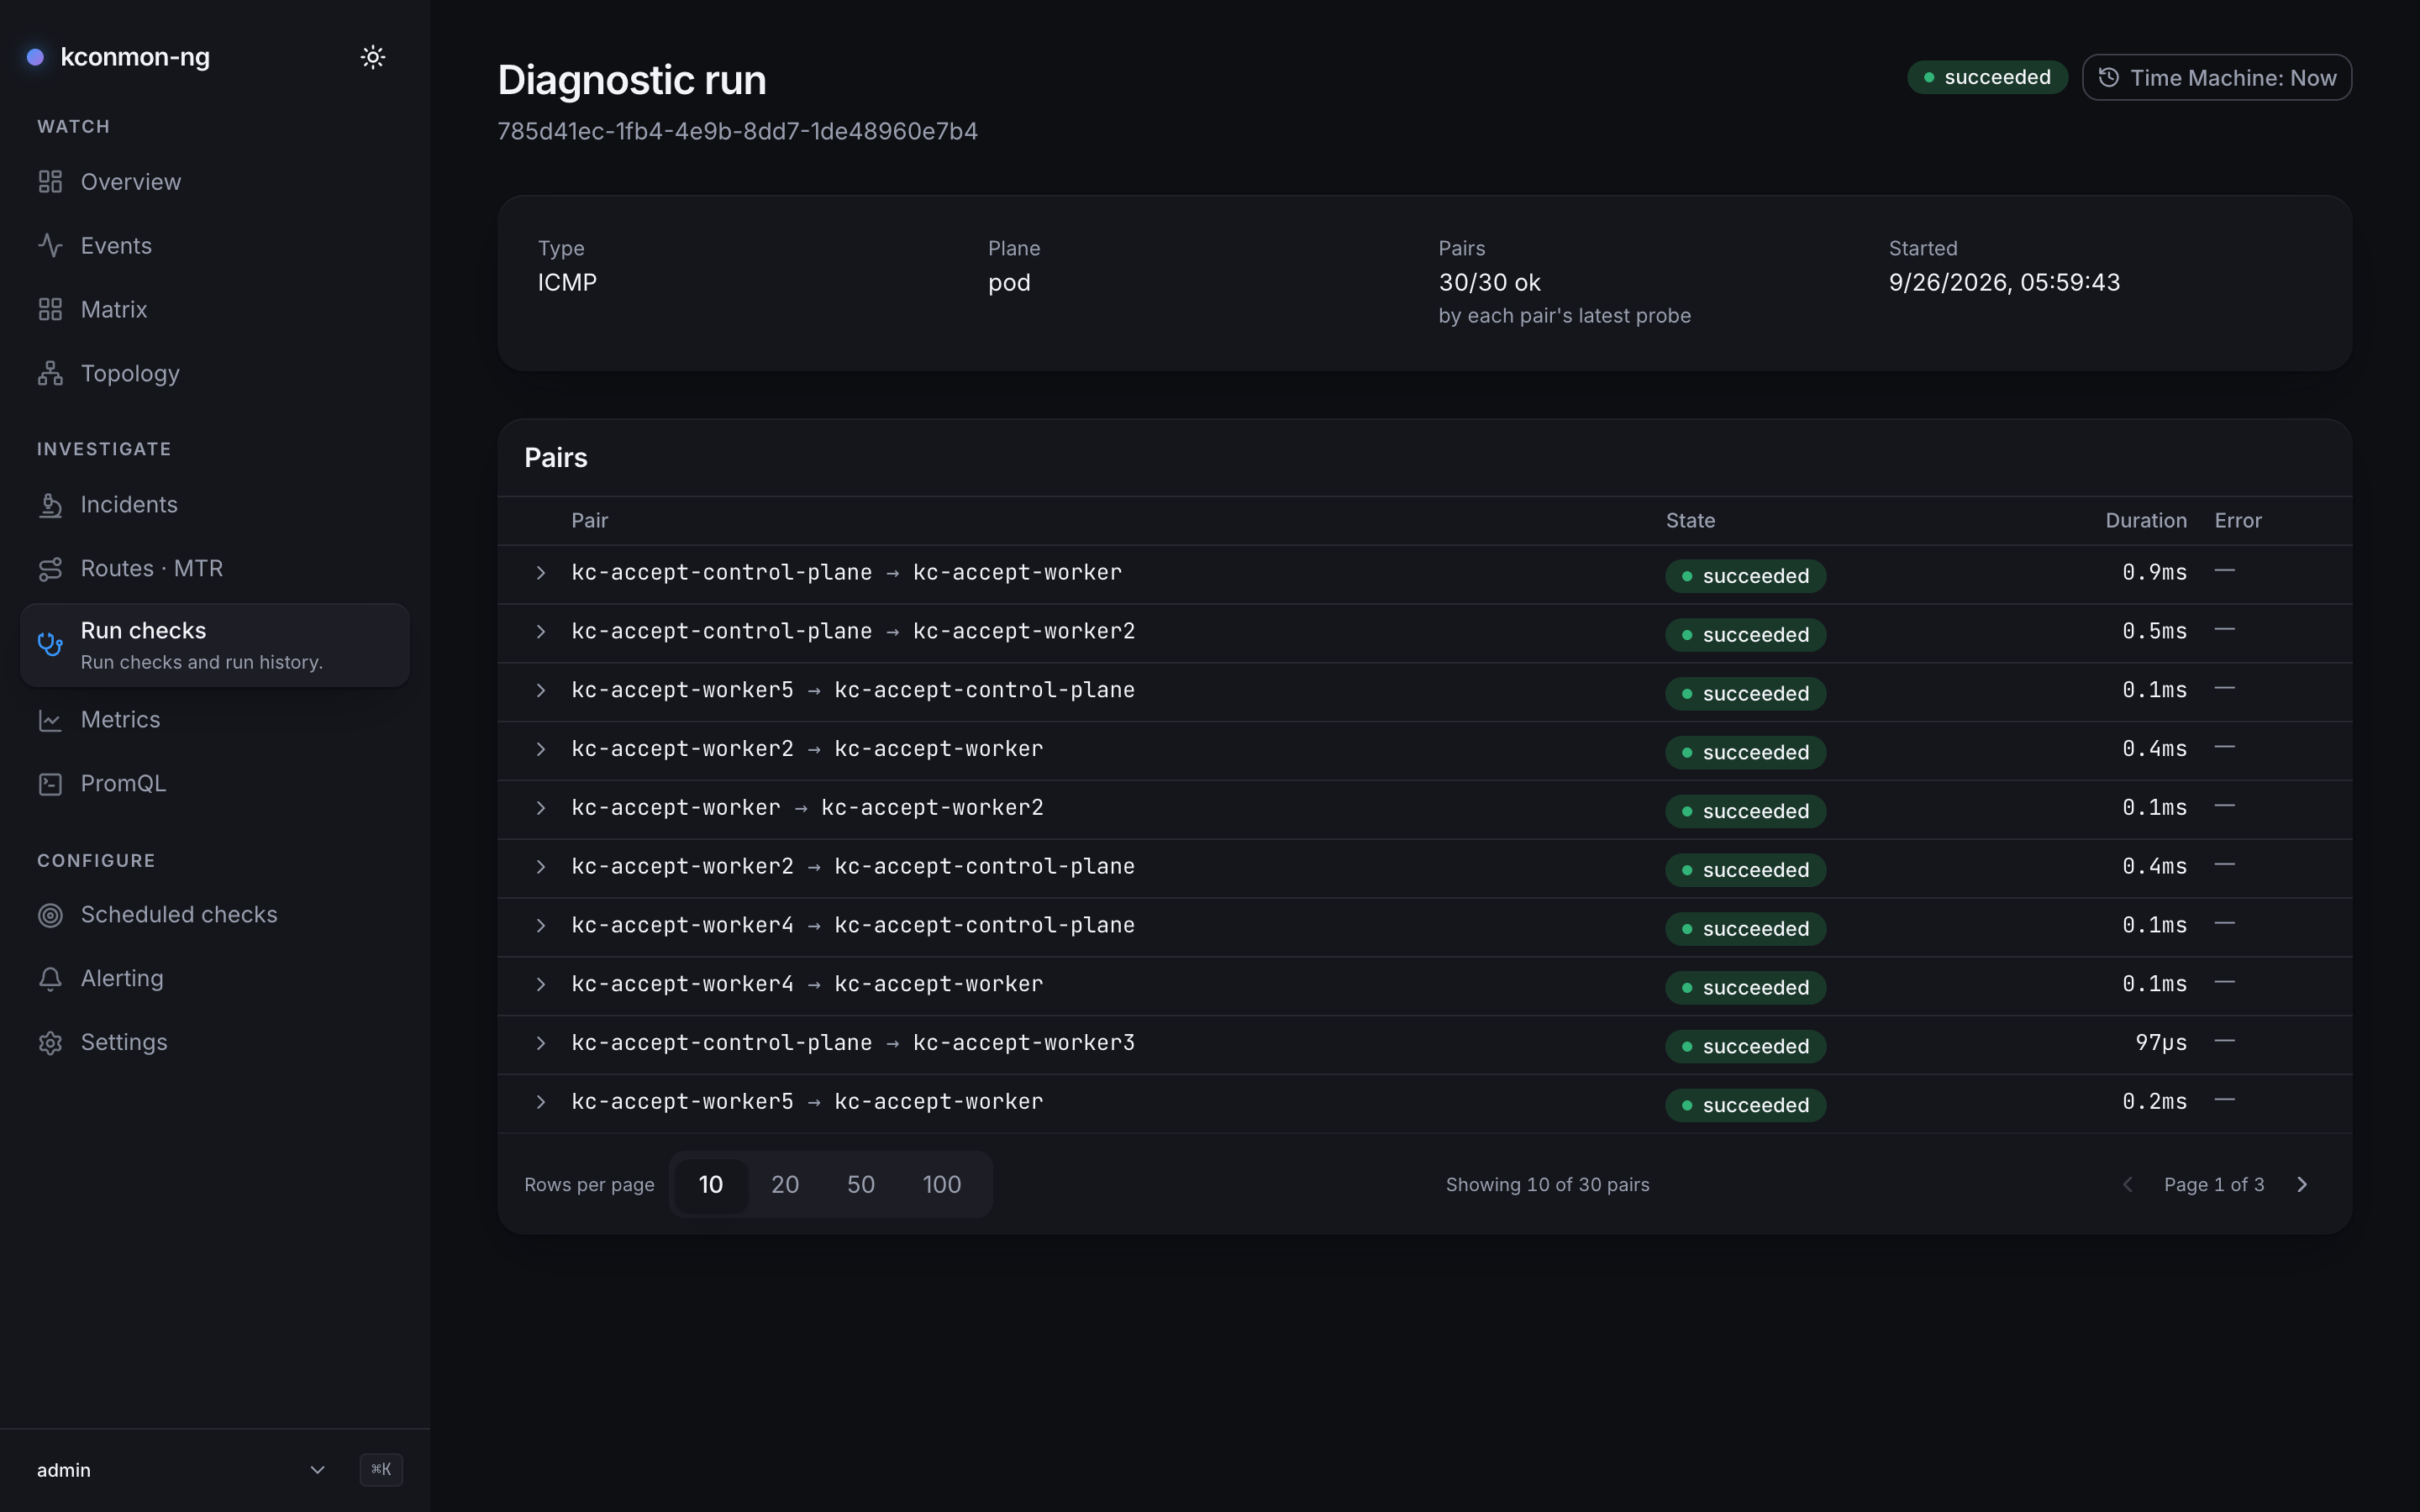
Run history (GET /api/v1/runs) is what the Run checks page lists, and what
the retention pruner sweeps daily after database.retentionDays: 90 days by
default, with 0 keeping everything.
Schedules
A schedule attaches a cadence to one check definition:
once- fires at a future timestamp, one time.
interval- fires at a repeat period, clamped up to a 10s minimum: a one-second schedule against a definition fanning out to hundreds of pairs would be a self-inflicted DoS.
continuous- the special kind that creates no runs at all. It tells the reconciler to push the definition to agents as a continuously-executing external check; the agents then probe on a 30-second interval with a 5-second per-probe timeout (the timeout is kept a small fraction of the interval so a hung probe cannot overlap the next one), and the reconciler re-asserts the desired state every two minutes even when nothing changed.
cron- refused, for now, with a 422 whose message says where you stand:
"cron schedules land in a later milestone: use
kind:intervalwithintervalNs, orkind:oncewithrunAt".
Nothing fires until the schedule loop is on: it is opt-in
(console.scheduler.enabled, default false, so an upgrade never silently
starts dispatching fleet traffic) and needs both a database and a reachable
controller.
With more than one console replica, each tick is wrapped in a PostgreSQL advisory lock, so exactly one replica dispatches per tick. The lock is tick-scoped, not replica-scoped: it rotates, and whichever replica wins the next tick carries on. A replica dying mid-tick therefore costs at most that one tick: due schedules stay due, and the next tick (seconds away) picks them up. The overlap guard asks the database, not replica memory, whether a schedule's previous run is still mid-flight, precisely because the replica that fired a run is routinely not the one holding the next tick.
Results and events
Results and events are separate streams with separate jobs:
- Results are measurements. Continuous checker results become Prometheus series scraped from each agent; run results are stored rows the Console shows next to each run.
- Events are facts about the fleet: agents joining and leaving, topology
changes, diagnostic runs starting and finishing. The controller streams them
when
controller.events.enabledis on; the Console's Events page is the live feed, the ingested history is what the Time Machine folds topology from, and Kubernetes core events can be captured alongside (console.kubernetesContext.enabled) into the incident timeline.