Incidents
Investigation Mode: one window over one scope, with every source the console can read merged into a single timeline and the correlation rules written down rather than guessed at. A pair went bad at 14:32; this page puts probes, fleet events, Kubernetes events, config changes, route changes and alerts on one axis so you can see what moved first.
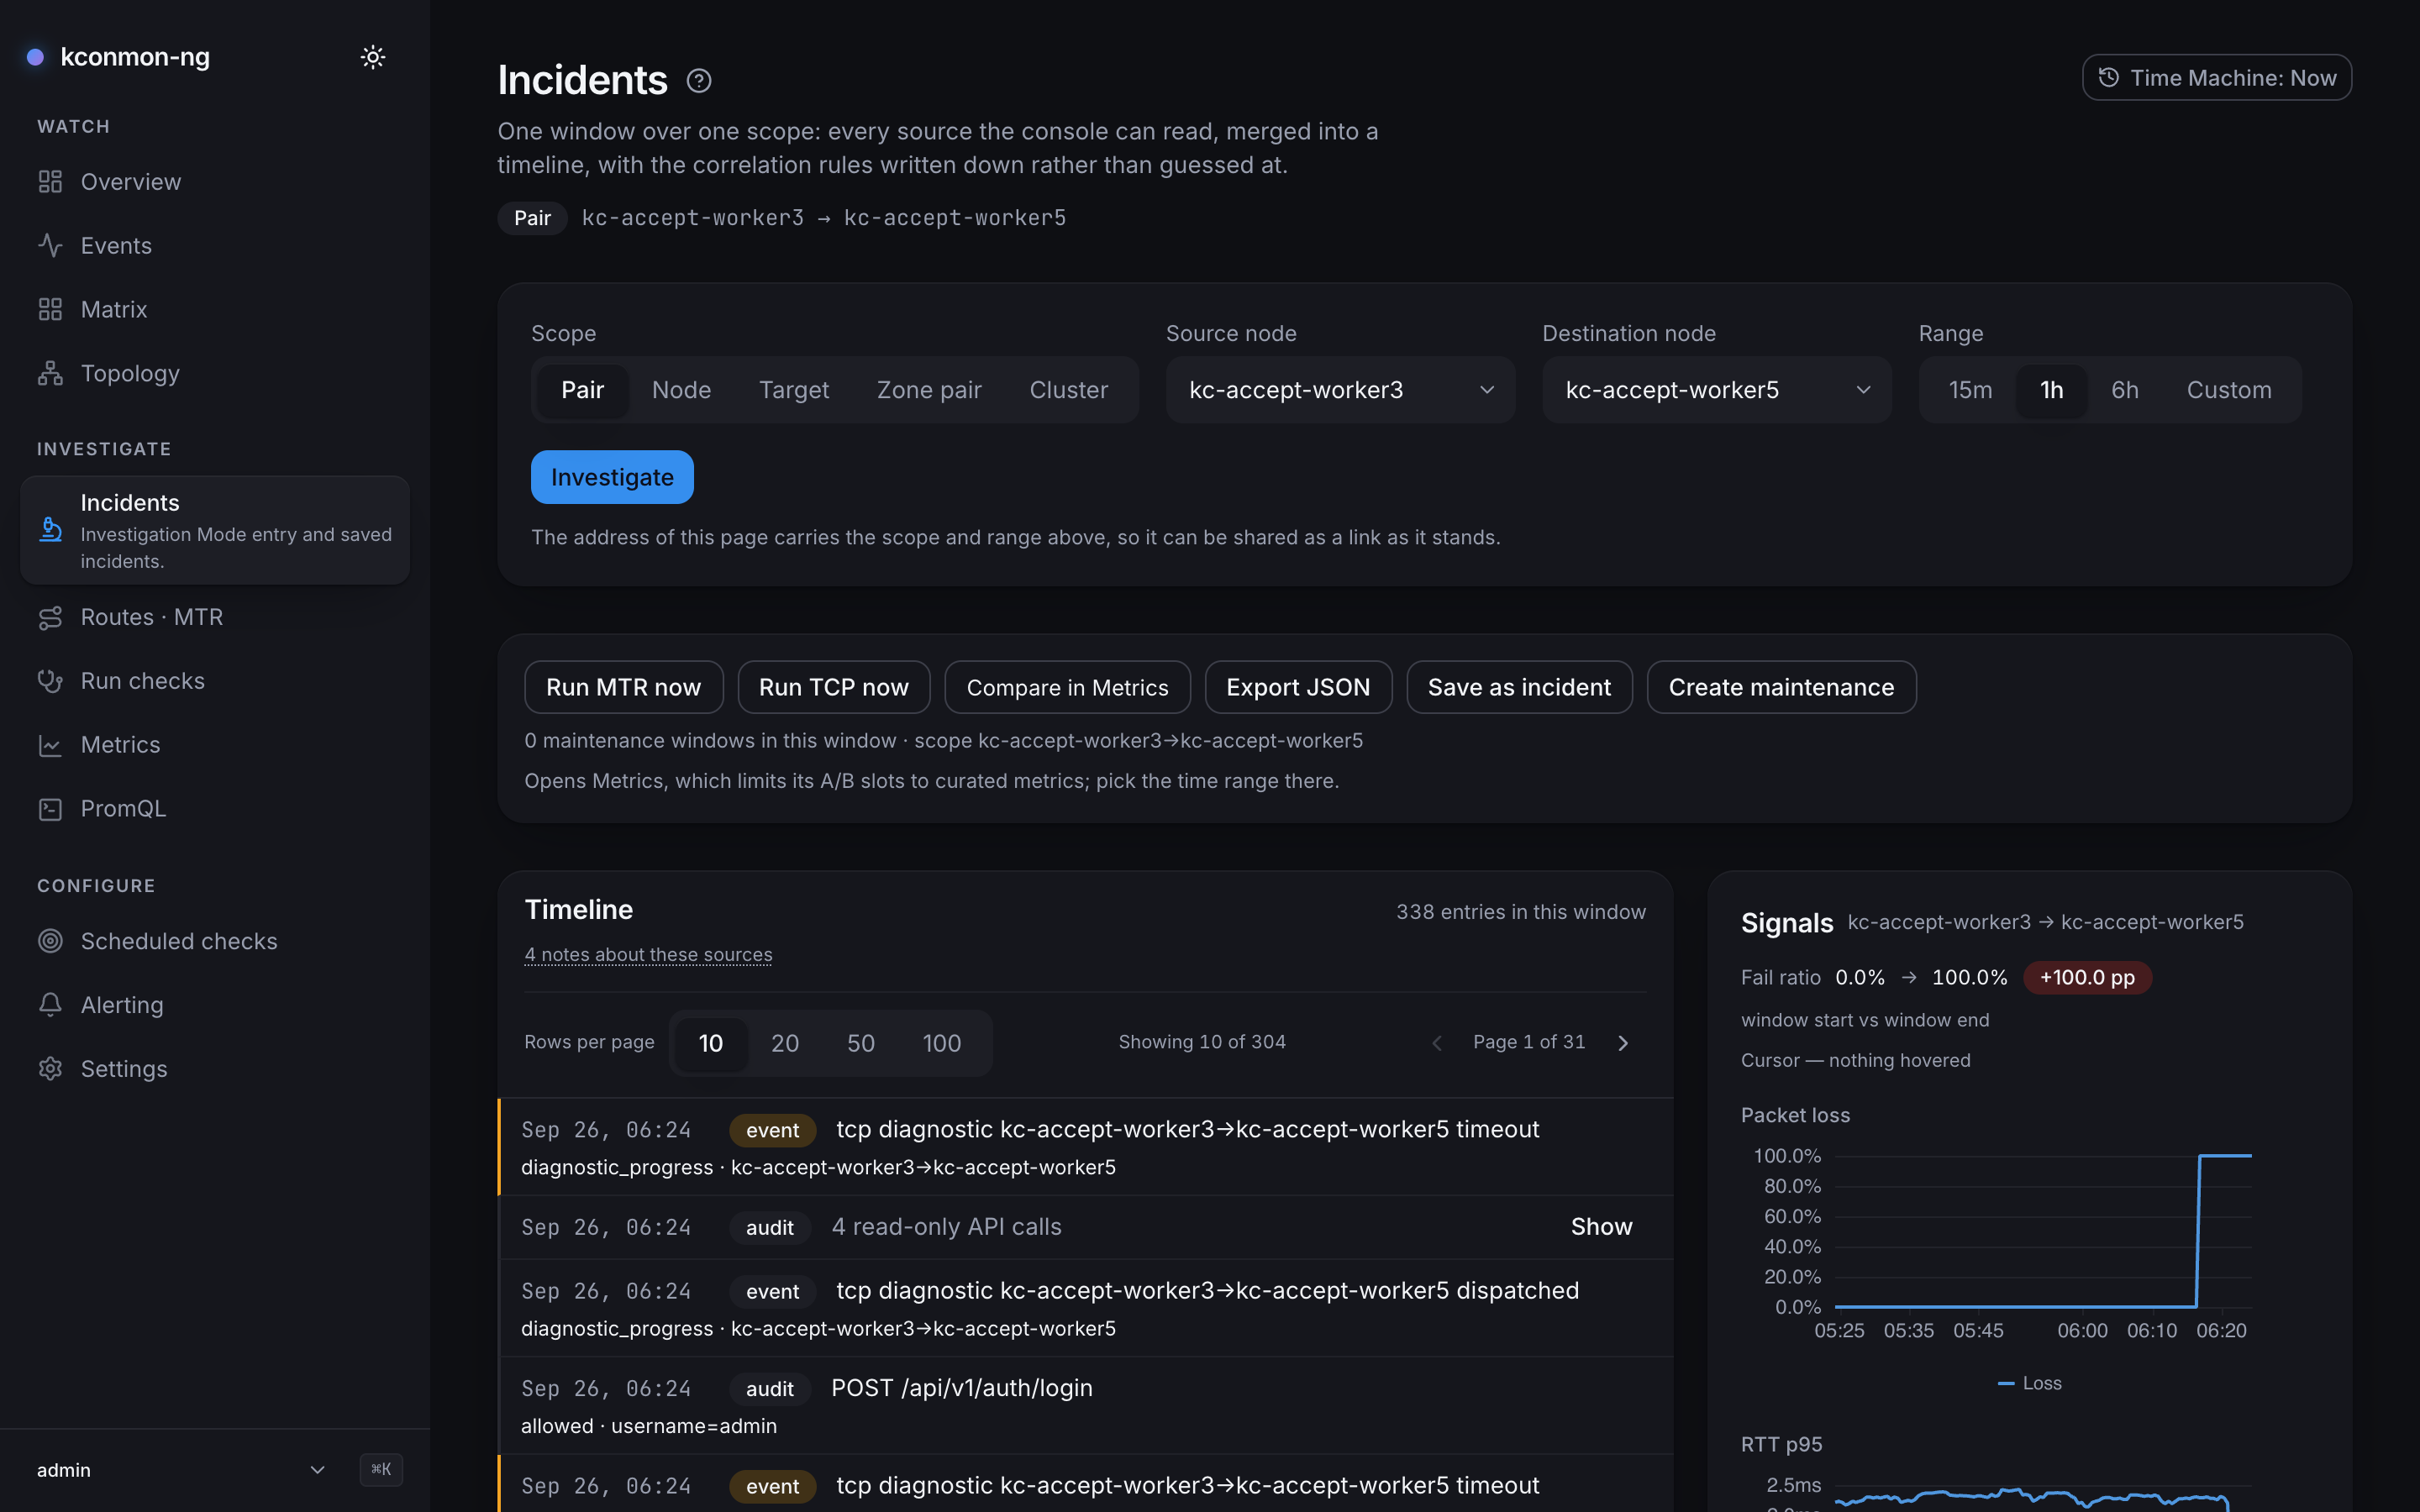
Scope and window
The entry form commits two things:
- Scope kind: Pair, Node, Target, Zone pair, or Cluster.
- Range: the presets
15m/1h/6h, or Custom with explicit start and end.
Everything lands in the URL (?kind=&scope=&from=&to=), which is what makes an investigation shareable and an incident permalink free: copy the address, everything travels. The note under the form says only that; the parameter names are listed here. A link with unreadable parameters degrades loudly: the page names the keys it could not read and corrects the address bar.
The timeline and its sources
The centre pane merges every readable source. Row badges: fleet event, k8s event, audit row, annotation, maintenance window, diagnostic run, MTR path change, derived threshold crossing, and firing alert.
Every absent, bounded or failed source gets one disclosure line naming the source, why it contributed nothing, and where the answer is bounded rather than absent, exactly what the bound is. The bounds, with their numbers:
- Audit rows are the newest 200 fetched and filtered client-side.
GET /api/v1/audithas no time filter, so a busy console can push older in-range rows off that page, and there is no scope filter either, so these rows are every subject's requests, not just this pair's. - Fleet events and Kubernetes events are fetched up to 200 per source for the window.
- Runs come from a client-side scan of the 20 most recent, the same bound the object pages disclose.
- Path changes need a pair, node or target scope, because
GET /api/v1/mtr/snapshotsrequires a source and destination. - Firing alerts are only the rules this console manages, and only the set firing now, since Prometheus keeps no firing history.
Sources gate individually on events:read, audit:read, annotations:read, mtr:read, runs:read, maintenance:read, alerts:read and promql:query, and most need the database. Without one, a single line says so and none of the stored sources is requested. When the console cannot read its own configuration (GET /api/v1/config failed), that line reads "Could not read the console configuration, so none of the stored sources was requested: {error}" instead.
Where the k8s rows come from. The console runs its own watcher that captures cluster events into the database and serves them back through GET /api/v1/k8s-events. It is off by default (console.kubernetesContext.enabled in the Helm values), because enabling it adds apiserver egress and an RBAC grant; it watches one namespace (empty means the release's own) with a 10-minute relist backstop against a silently wedged watch.
Pinned findings and notes
Timeline rows can be pinned (needs incidents:write) into a Pinned findings pane, each with a "why this matters" note and the timeline's own badge word for its kind (a pinned route change reads path change). Three row classes cannot be pinned (maintenance windows, threshold crossings and firing alerts), and the pane explains why instead of hiding the control.
Below the causes panel sits a separate Notes on this scope card. It is the annotation surface for the investigated scope, frozen to the investigation window: the notes operators dropped on this object during this period, with the same + annotate control the Metrics page carries. Pinned findings belong to an incident; these notes belong to the scope.
Likely causes
The panel ranks candidate rows by how close they sit before the detected onset. The method is four arithmetic steps, no model, and the panel links its own scoring source:
- Onset is the earliest non-info threshold crossing in the window: loss above 1%, or RTT above twice the range median. No onset in range means nothing is ranked: a ranking needs an anchor, and the page will not invent one.
- Candidates are rows in the 5 minutes before the onset. Long enough to catch a rollout that started before the probes noticed; short enough that an unrelated change an hour earlier cannot claim credit.
- Weights by row kind: path change 3, k8s event 3, fleet event 2, audit row 2, maintenance window 1, everything else 0. A maintenance window scores low deliberately, because it explains a degradation rather than implicating anyone. Read-only audit rows are excluded outright: the audit log records authorization decisions, so without that rule the console's own GETs (including the two PromQL queries this very page fires to draw its charts) would arrive as weight-2 "config changes" and out-rank the real causes. Four POST routes count as reads too, because they store nothing: the two PromQL queries and the draft previews the forms on Scheduled checks and Alerting send while you type (
POST /api/v1/checks/projection,POST /api/v1/alert-rules/preview). Audit rows of requests the server refused or that failed (outcomedeniedorerror), and of sign-in, sign-out and password changes, are not ranked either, since none of them changed the configuration; unlike read-only calls, which fold into one row, they stay in the timeline as rows of their own. - Score decays linearly across the window:
weight × (1 − delta/window). Linear rather than exponential because it is the shape you can verify by eye against the "{delta}s before the onset · weight {weight}" label on each candidate.
Working an incident
The actions rail: Run MTR now, Run TCP now (both start a run via POST /api/v1/runs, needs runs:create), Compare in Metrics (opens Metrics; its A/B slots stay bound to curated metrics, so the window is chosen there), Export JSON, Save as incident, Create maintenance. A maintenance window created here holds back the console's alert webhooks in its scope while it is open (Alerting). On a pair, node or target scope that is the object's alerts; a zone-pair or cluster scope creates a global window, which holds every console alert webhook, and the form warns about it.
Export JSON downloads the whole investigation, not just the pins: the committed parameters (kind, scope, from, to), every assembled timeline entry (timestamp, kind, severity, title, detail, reference), and the ranked causes with their scores. The filename is derived from the window start, with the ISO colons made filesystem-safe.
Save as incident (needs incidents:write) stores the scope, window, title and notes; a zone-pair or cluster scope saves as the global scope and the dialog says so. A saved incident gets a permalink, /investigate?incident=<id>, and reopening it shows the incident strip: status (Open / Resolved), who opened it ("opened by {who}", your display name when it was you, with the raw subject id on hover; anyone else's raw id, since only users:manage can resolve other subjects), Copy permalink, Resolve / Reopen, Delete (with confirm), and editable notes, which keep line breaks and tabs (any other control character is refused with 422). Notes typed while a save is in flight are kept, and a save that lands after you switched to another incident does not write into that incident's editor. Open incidents also surface on the Overview. An incident permalink carries only ?incident=<id>; the stored row, not the URL, decides what the page frames.
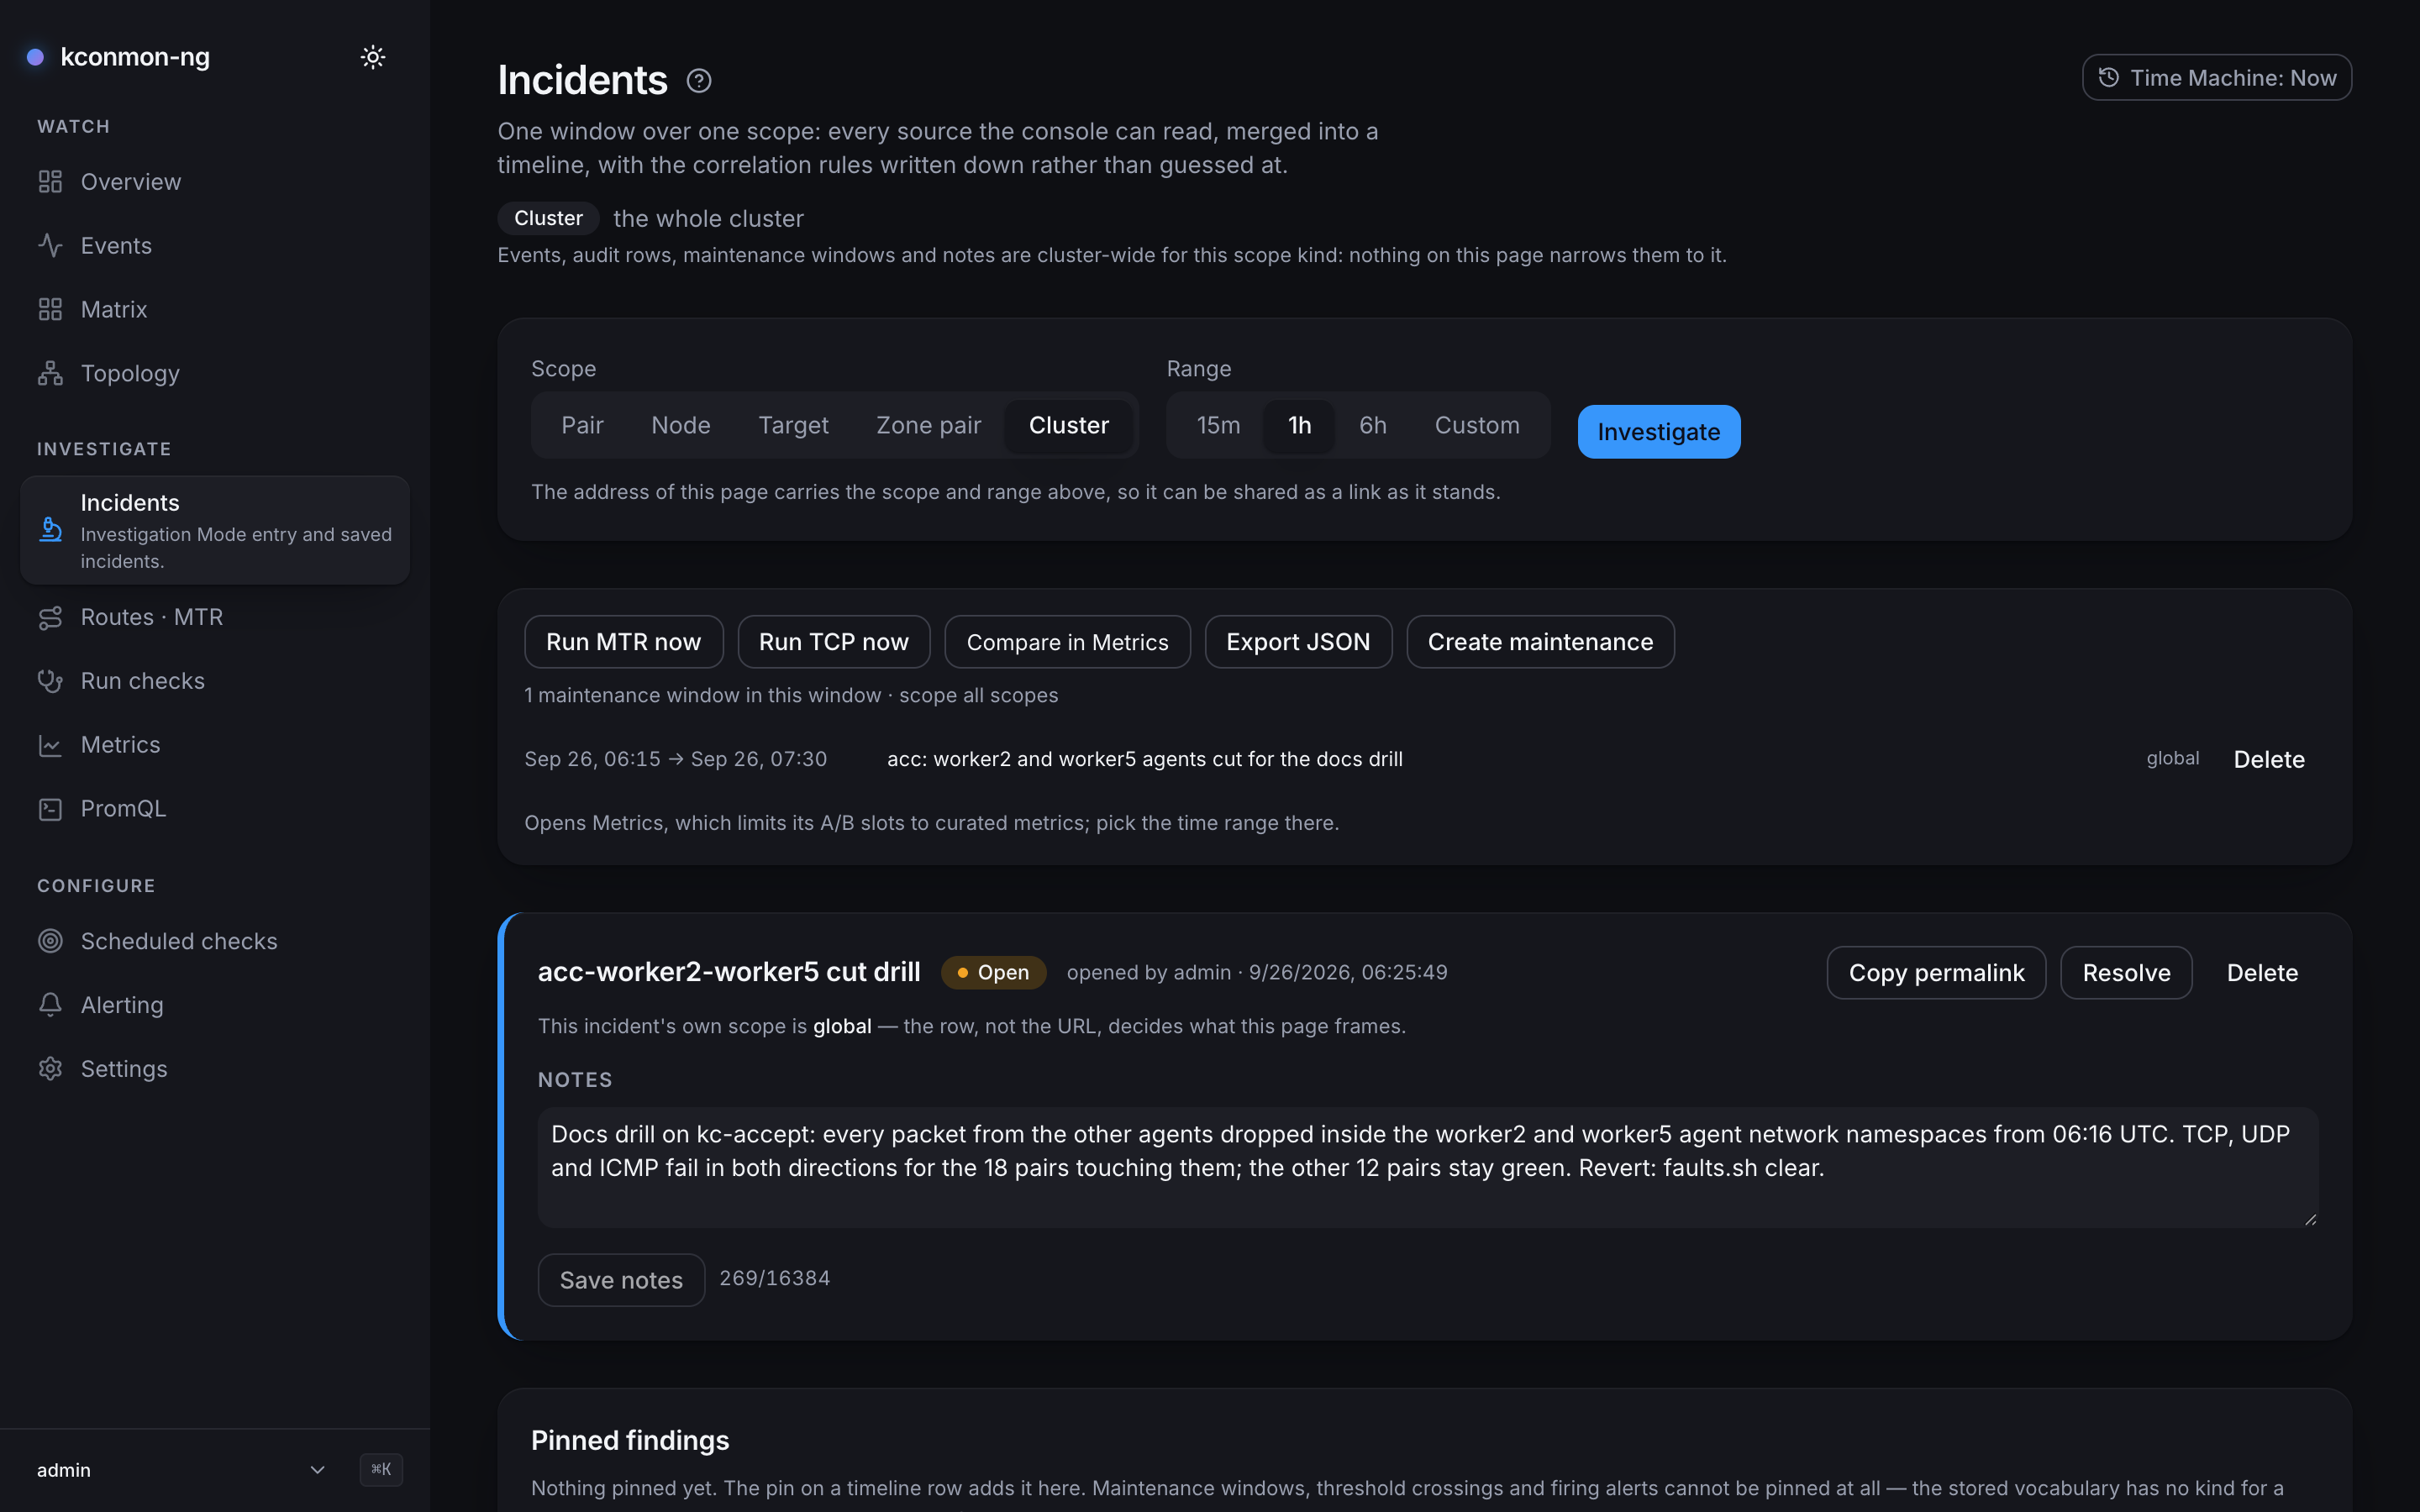
Saved incidents
With no incident open, the page shows a Saved incidents card above the entry form: every saved incident, newest first, each row linking to its permalink and showing its status, its scope (global for a zone-pair or cluster save) and when it was opened and resolved. The All / Open / Resolved filter is the status parameter of GET /api/v1/incidents. The card fetches 50 at a time: Load older follows the list's keyset cursor for the next 50, and the pager pages through what has been loaded. It needs incidents:read and the database, and says which one is missing instead of requesting. On an incident permalink the card is hidden.
Under the Time Machine the card lists only the incidents saved by the instant on screen, each with its status at that instant: Resolved only if it was resolved by then. The filter then applies on the page, because the server's status is a fact about now.
Getting here
Every investigate affordance in the console lands here pre-scoped: Overview's worst-pair and alert rows, Matrix cells, and the object pages' entry points. For a worked example, see Diagnose a slow pair.