Overview
The landing page. Before any detail, it gives a verdict: is the fleet healthy right now, and if not, which pairs are the problem? Since this is also the first page of the console guide, the end of this chapter covers the chrome around every page: the sidebar, the user menu, the command-palette hint and the "?" help buttons.
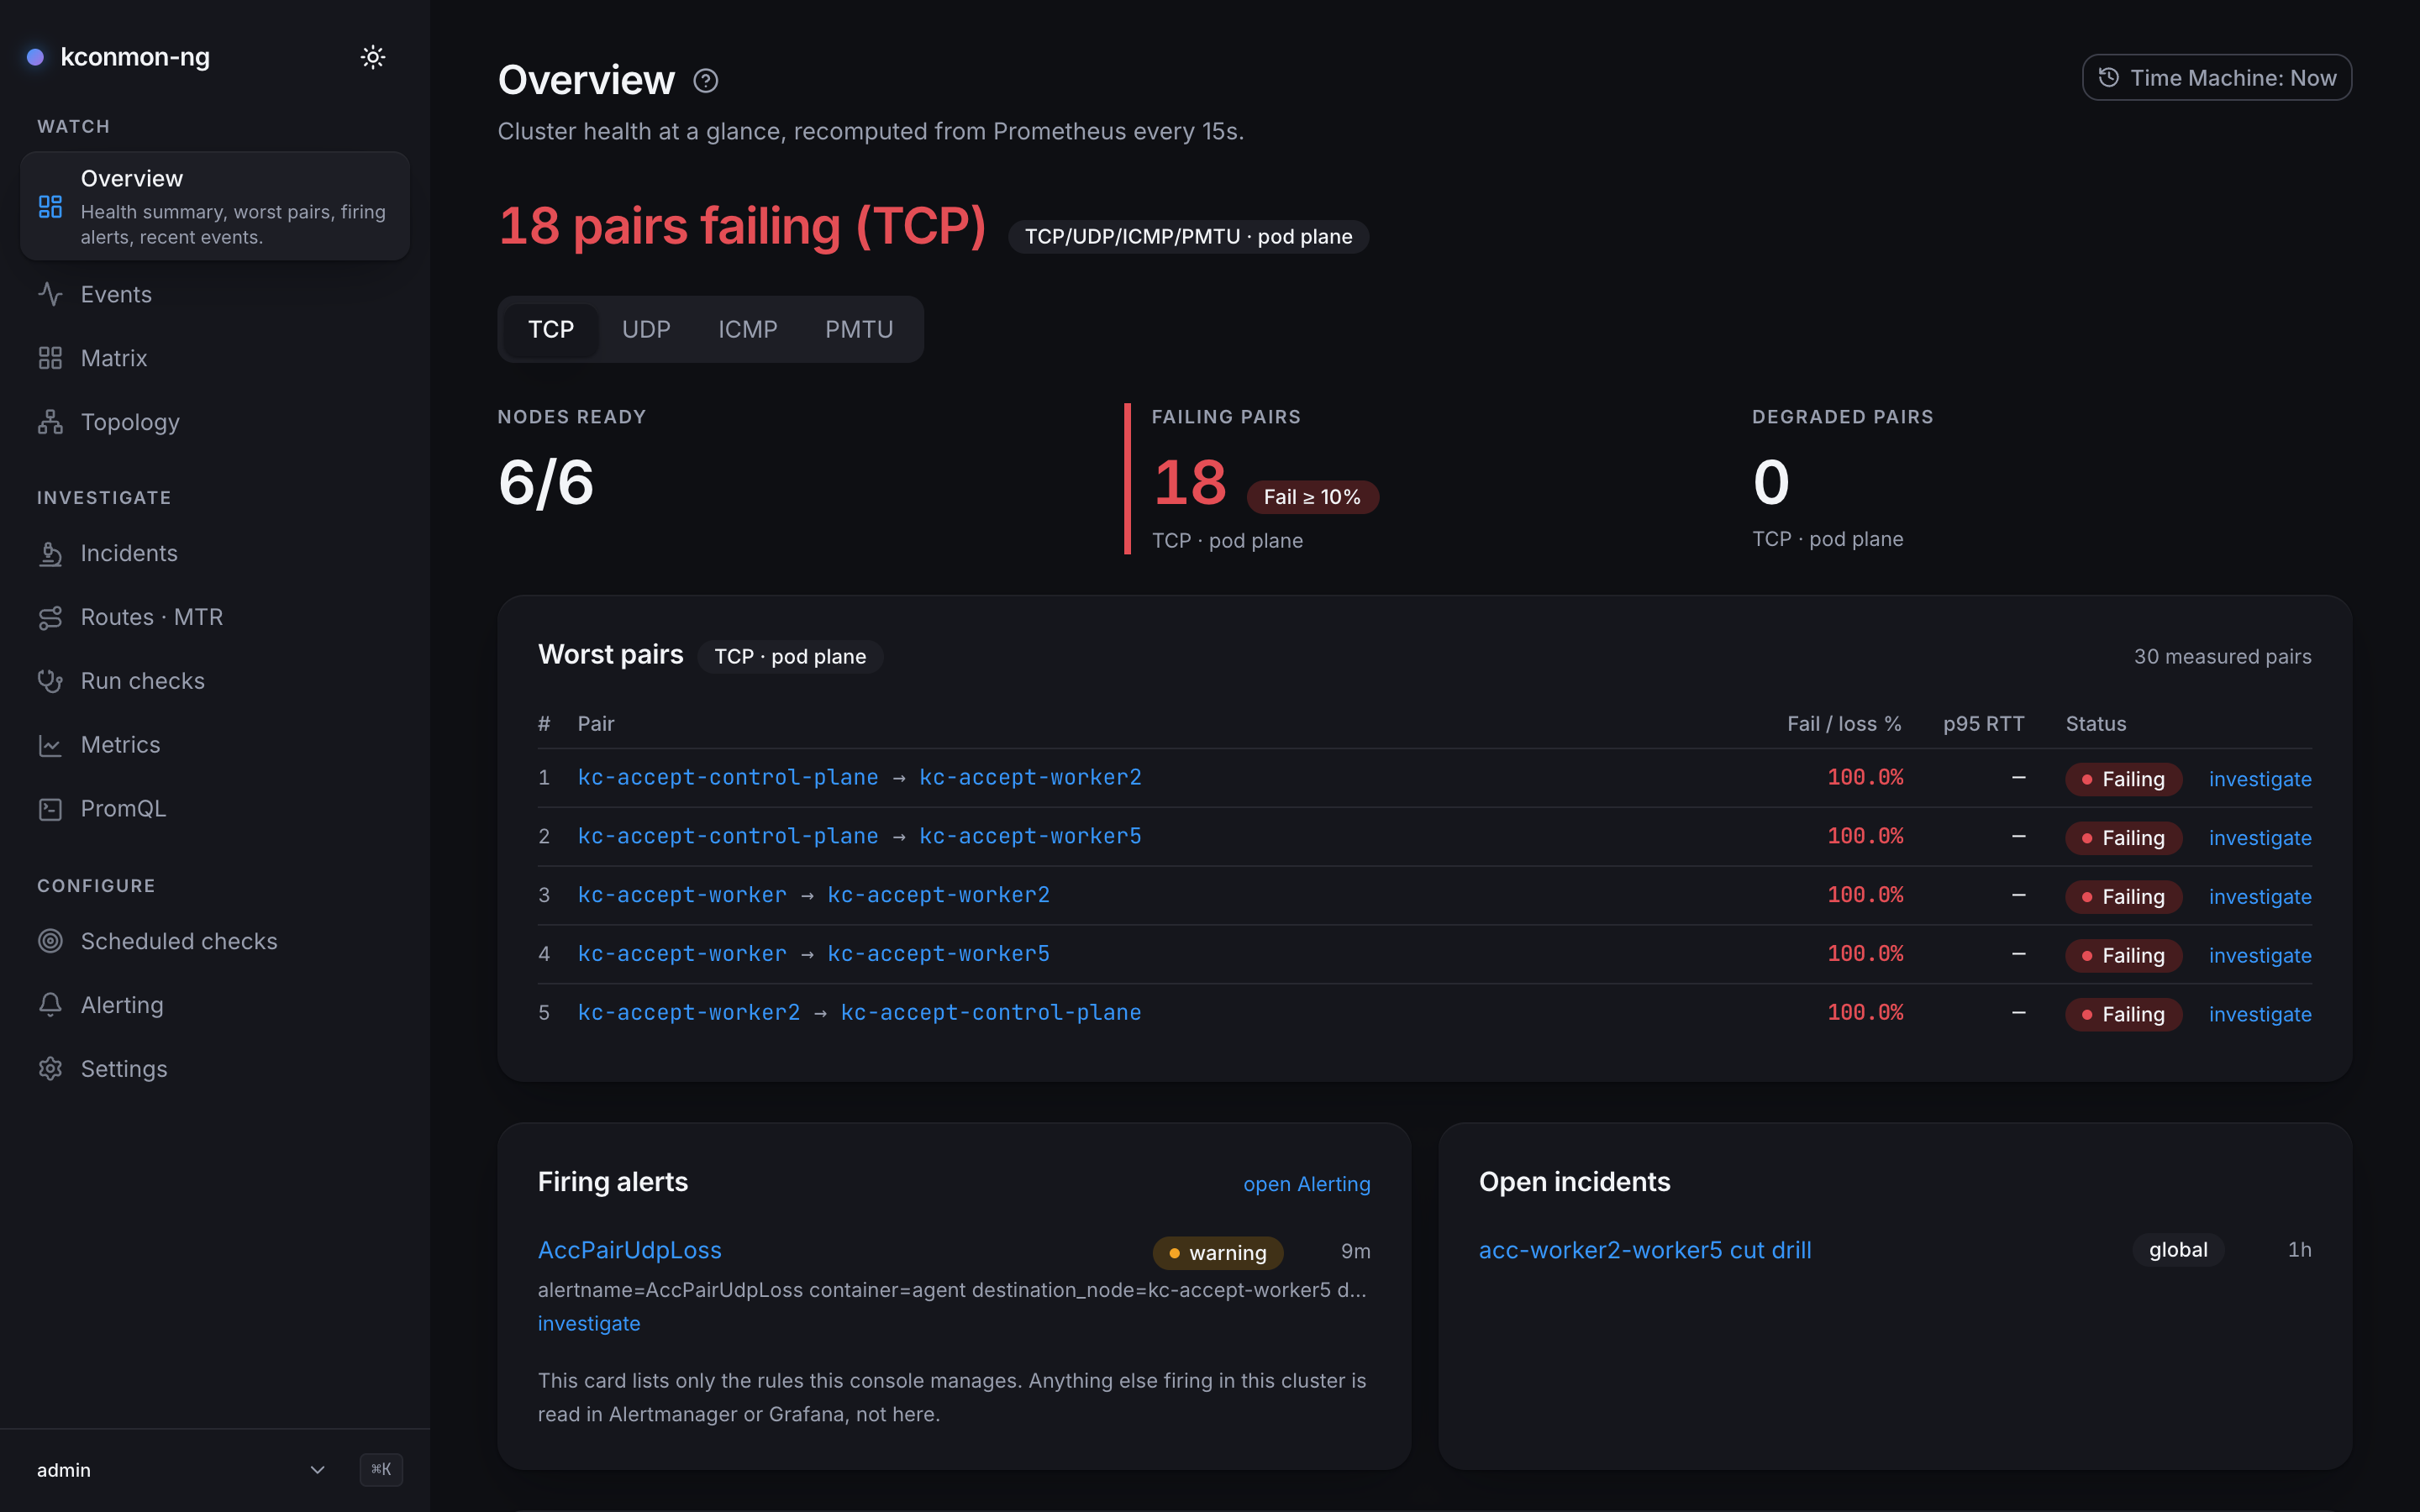
The page reads all four protocol matrices (TCP, UDP, ICMP and PMTU) on the pod plane. The health statement at the top covers every protocol and carries the chip TCP/UDP/ICMP/PMTU · pod plane. The tiles and the worst-pairs table below it show one protocol at a time, picked with a TCP / UDP / ICMP / PMTU selector, and every pair number there carries the qualifier {protocol} · pod plane. Until you touch it, the selector follows the trouble: it opens on the protocol with the most failing pairs (then the most degraded ones), and on TCP when every protocol is clean. Unlike the Matrix switch it is not written to the URL. There is exactly one plane in this release; the Plane field on Scheduled checks explains that scope cut.
While live, the page recomputes from Prometheus every 15 seconds. With the Time Machine engaged nothing refreshes, and the page states cluster health at the instant you are viewing.
The health statement
The header leads with the verdict in words, computed from the pair matrices. Trouble names its protocol: "3 pairs failing (UDP)" comes from the protocol with the most failing pairs, and "2 pairs degraded (PMTU)" from the one with the most degraded pairs when nothing fails. The count is that protocol's own; the same node pair exists on every protocol, so counts are never added across them. The healthy claim waits until all four matrices have answered, then reads "All 42 pairs healthy" off the protocol with the most scored pairs, or the scoped variant "All 40 scored pairs healthy" when some measured pairs carry no failure-ratio samples. It only speaks when at least one pair is scored; a health claim needs evidence.
Two words on this page have precise meanings:
- Measured means something probed the pair: the cell carries at least one finite sample, whether a failure ratio, an RTT, a packet-loss reading or a path MTU.
- Scored means the pair can be ranked: its failure ratio is an actual finite number. This is deliberately stricter than "not null". An absent key arrives as
undefined, andNaNorInfinitycompare false against every threshold, so any of them counted as scored would pad the healthy total with pairs nobody ranked.
The gap between the two is stated wherever it exists, never smoothed over.
Cluster health summary
Three stat tiles:
| Tile | Meaning |
|---|---|
| Nodes ready | Ready nodes out of the Kubernetes node inventory. When the controller has no k8s node view, the tile counts registered agents (or matrix rows) instead and says so; readiness is then unknown. External agents are not in the count, since a bare host has no Kubernetes readiness to report; instead the tile adds a "+{n} external agent(s)" line under the number, so 10/10 over +1 external agent describes eleven vantage points, ten of them nodes. The hint rides only on the Kubernetes count: when the tile falls back to counting agents, the host is already in the number and no hint appears. |
| Failing pairs | Scored pairs the matrix paints red: the worst of failure ratio and packet loss ≥ 10% ("Fail ≥ 10%"), or on PMTU a black hole ("Black hole"). |
| Degraded pairs | Scored pairs the matrix paints amber: the worst of failure ratio and packet loss between 1% and 10% ("Fail 1–10%"), or on PMTU a reduced or recovering path ("Reduced or recovering path"). |
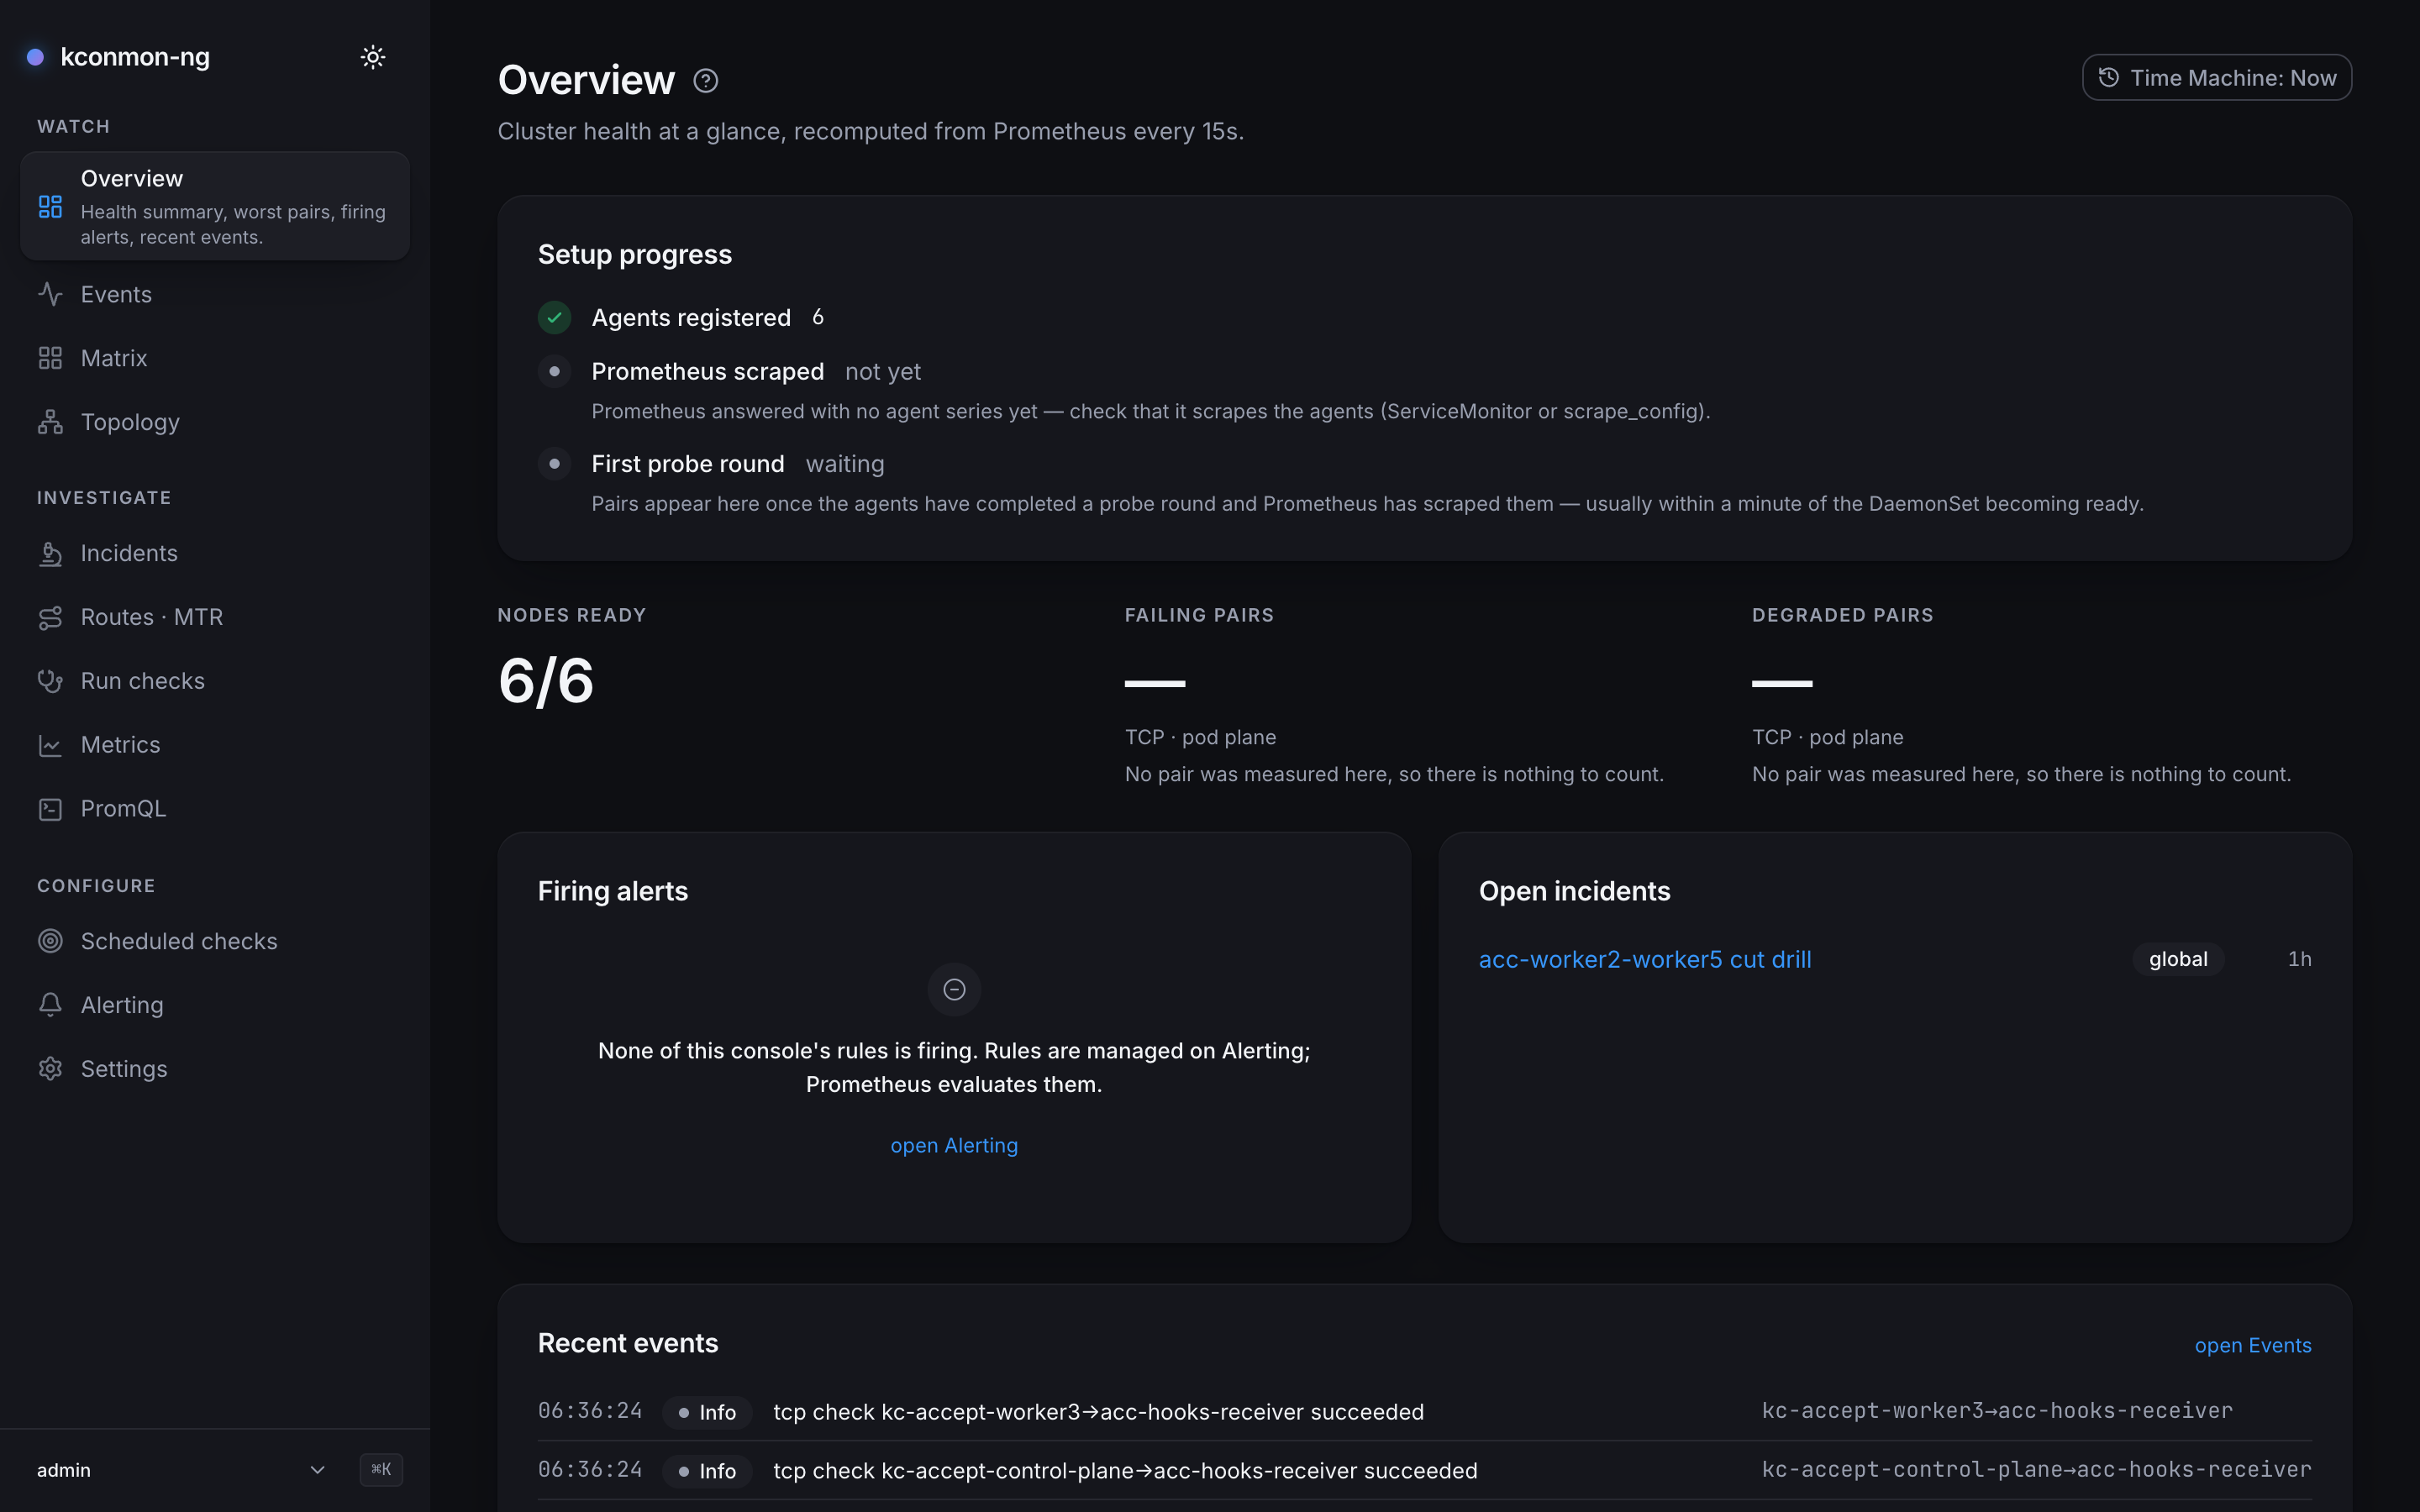
On a cluster with no probe data yet the pair tiles show an em dash rather than a 0. The console never turns "nothing measured" into a measured zero; Matrix is the canonical statement of that rule.
Under the Time Machine, the Nodes-ready tile cannot ask Kubernetes about the past. It is reconstructed by folding stored topology events up to the viewed instant, and it discloses the bounds of that fold when they bite: "The event window was truncated, so this reconstruction is partial", or "{count} events carried no node detail and could not be folded in".
Worst pairs
The Worst pairs table holds at most five rows: scored pairs only, failing or degraded only. Red pairs rank before amber ones, then by the worst of failure ratio and packet loss, with p95 RTT as the tiebreak. The tier comes first because on PMTU a black hole at 3% failures is red while a recovering path at 40% is amber. Two pairs failing at the same ratio are not equally bad, and the slower one ranks higher. Columns are Pair, Fail / loss % (the worst of the two ratios, the figure the matrix colours a cell by), p95 RTT (Path MTU / probe on PMTU) and Status (Failing / Degraded). The pair name links to that pair's pair page; each row also carries an investigate link that opens Incidents pre-scoped to the pair. When either end of a pair is a bare-host agent, its name wears a neutral external badge, the same word the Topology map and the node card use. The badge is identity, not status: it says where the agent runs, and the row's Failing / Degraded verdict still comes from the pair's matrix tier. It is painted from the kconmon-ng.io/external registration label, so an agent older than 2.4.0 appears as an ordinary node name.
When only some measured pairs have a failure ratio, the table says so: "{scored} of {total} pairs have a failure ratio; the rest have no failure samples." An empty list distinguishes three cases: no probe data in Prometheus yet, pairs reporting latency but no failure-ratio samples, and the healthy case, "No failing or degraded pairs". On TCP, UDP and ICMP the healthy slate adds that every scored pair sits under a 1% failure ratio. On PMTU, where a black hole can fail far less often than that, it says instead: "Every measured path carries full-size datagrams. A reduced path or a black hole shows up here, worst first." Its open Matrix link opens the Matrix on the protocol selected here.
Firing alerts, open incidents, recent events
Three summary panels under the table, each with a hard cap:
- Firing alerts shows up to 8 firing rules this console manages (
GET /api/v1/alerts?managedOnly=true); beyond that it prints "{count} more firing alerts are not shown here." A quiet list is a fact about this console's rules only: other rules' firing state lives in Alertmanager or Grafana. Needsalerts:readand a configured Prometheus, and it is live-only: Prometheus keeps no firing history, so the panel shows nothing under the Time Machine. Each row links to its rule on Alerting (/alerting?rule=<id>) and offers an investigate link. - Open incidents lists the 5 newest open incidents from
GET /api/v1/incidents, each linking to its incident permalink. With none open, the empty slate says that saving an investigation on Incidents opens one and links open Incidents. Needsincidents:readand the database. Under the Time Machine it lists the incidents declared by the viewed instant and not resolved by then, whatever window they were saved with, the same rule the object pages' incident card follows. To find them it scans the incident list newest first, 100 at a time, and stops after 50 pages; when it stops before the list ends, the panel says so: "The scan stopped at its page limit, so an older incident open at this instant may be missing." - Recent events shows the 10 newest fleet events from
GET /api/v1/events, with an open Events link to the full Events feed. Needsevents:readand the database.
Without a database the Open incidents and Recent events panels each say where to set one and request nothing. That verdict comes from GET /api/v1/config; when that request itself fails, the panels say "Could not read the console configuration, so nothing was requested: {error}" with the server's detail, instead of sending you to a key that may well be set.
First run
While no pair is measured on a fresh install, a Setup progress card replaces the empty state and tracks Agents registered → Prometheus scraped → First probe round. Each unmet step carries a one-line fix, e.g. "Prometheus answered with no agent series yet — check that it scrapes the agents (ServiceMonitor or scrape_config)."
When series are missing
Since 2.3.0 the chart carries a scrape-time cardinality valve, agent.metrics.detail (full | counters-only | zone-only, charts/kconmon-ng/values.yaml). It changes what this page can compute:
counters-onlydrops the four per-pair histograms at scrape time. The failure counters stay, so the health statement, the tiles and the worst-pairs ranking keep working, but the p95 RTT column goes dark and the RTT tiebreak has nothing to break ties with.zone-onlydrops every series naming a destination node. No pair is measured at all from this page's point of view, and it renders as a fleet with no probe data.
The same valve shapes Matrix, Metrics and the pair and node pages.
Deep links
- Pair name →
/pairs/<source>/<destination>(pair page) - investigate (worst pair or firing alert row) → Incidents scoped to that pair or alert
- open Alerting → Alerting; open Events → Events; open Incidents (empty Open incidents panel) → Incidents
- open Matrix (healthy Worst pairs slate) → Matrix on the protocol selected on the Overview (
?protocol=)
All links carry the current ?at= instant when the Time Machine is engaged.
The console chrome
Everything below wraps every page in the console; it is described once, here.
Sidebar. Twelve pages in three groups, and the grouping is the intended workflow: Watch (Overview, Events, Matrix, Topology) for standing awareness, Investigate (Incidents, Routes · MTR, Run checks, Metrics, PromQL) for digging into a problem, Configure (Scheduled checks, Alerting, Settings) for changing what the fleet does. The active entry shows its one-line description under the label; the same description is the hover tooltip and the command palette's search text, kept in one table so they can never disagree.
Old page names. Several pages carry names that differ from their paths and from older releases, so no label collides with another surface. The old names still work in the command palette's search, because muscle memory keeps typing them:
| Old name | Now |
|---|---|
| Live | Events |
| Investigate | Incidents |
| Explore | Metrics |
| Console | PromQL |
| Diagnostics | Run checks |
| Targets | Scheduled checks |
Theme toggle. Top of the sidebar, next to the product name; its label names the theme it switches to. The palette has the same action under View.
Sidebar footer. With a signed-in user, the footer shows the user menu: display name, the roles the server resolved for you, Sign out, (only with tokens:manage) a link to API token management, and in local auth mode Change password, which asks for the current password (see Users). In anonymous mode the footer is a plain product line instead, since there is nobody to sign out. Beside it sits a ⌘K / Ctrl+K badge: the palette's one visible trace in the chrome.
Anonymous-mode banner. When console.auth.mode is anonymous (the default), a warning banner spans the top of every page: "Anonymous mode. Authentication is disabled — everyone has the {role} role (console.auth.anonymous.role). Do not use in production." It names the actual configured role. Settings covers the auth modes.
Live / Delayed data badge. Pages fed by the realtime stream (Events, Matrix, run permalinks) carry a transport badge. Live means pushed WebSocket updates are arriving. Delayed data means this console replica is not receiving the controller event stream and has fallen back to REST polling every 15 s. That is a supported deployment (controller.events.enabled: false), not an error, which is why the badge is amber and not red.
Narrow viewports. Below 48 rem the sidebar becomes a drawer behind an "Open navigation" button, and it closes itself after each navigation. The open drawer has its own Close button beside the theme toggle, and Escape closes it too. That is 768 px at the browser's default text size and wider with larger text (960 px at 20 px), since the breakpoint follows the text size like the rest of the layout.
The "?" help button. Every sidebar page has a small ? after its title. It opens a few sentences of orientation plus a Learn more link pointing at that page's chapter in this guide. The URLs are built as <docs site>/console/<slug>/ from the file names under docs/console/, so renaming a file here silently breaks the in-app links. The in-app text is the short form and these pages are the long form; when one changes, check the other (web/src/components/page-help.tsx and each page's help.body string). Object pages reached by clicking into things (pair, node, target, run) have no help button; their orientation lives on the page that linked to them.