Run checks
On-demand diagnostics: does this path work right now, from these nodes, with this protocol? A run form sits on top, run history underneath, and every started run gets a permalink page of its own, documented below, because it is its own screen with its own controls. Starting a run needs runs:create; without it the form is replaced by a card and the history stays readable.
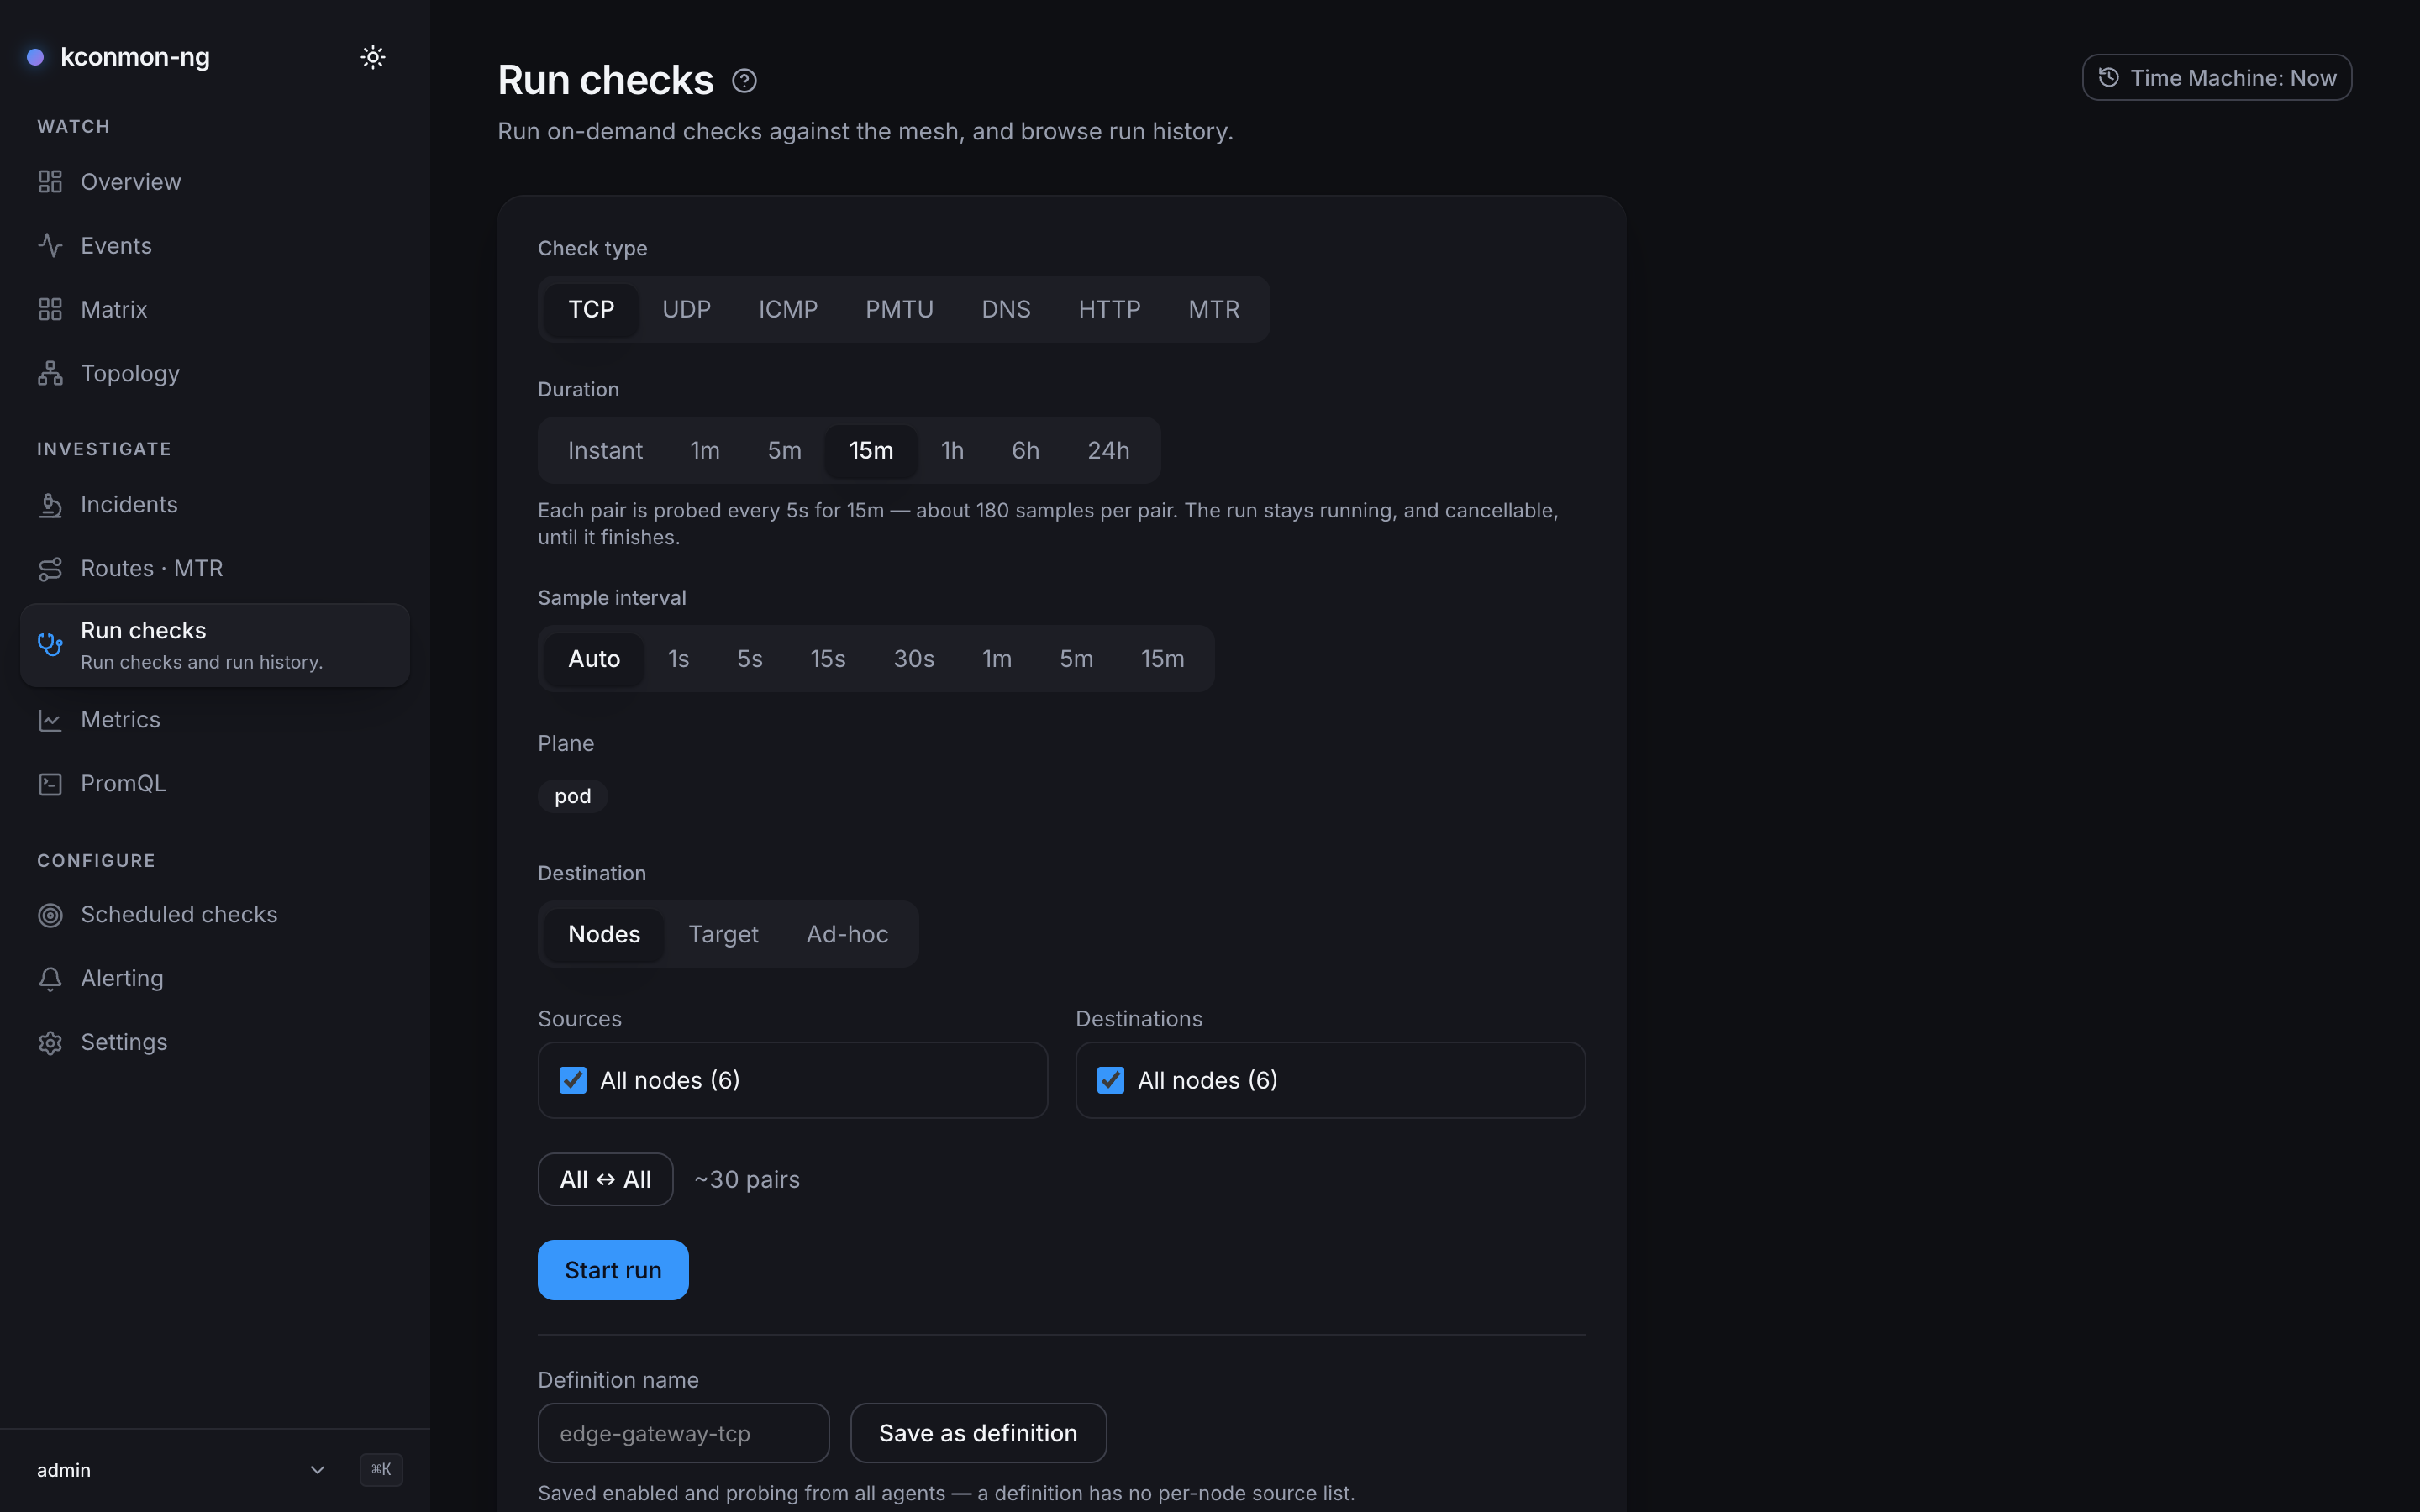
The form
- Check type:
tcp,udp,icmp,pmtu,dns,http,mtr. - Duration: Instant ("One probe per pair, right now.") or
1m/5m/15m/1h/6h/24h. For interval runs the caption spells out the plan before you press Start run: probe cadence, run length, expected samples per pair, and that the run stays cancellable throughout. MTR and PMTU runs plan their own slower cadence around the per-pair timeout (below): a trace walks up to 30 hops in sequence, and a PMTU probe of a black-holed pair takes up to about 10 s. The caption and the run permalink show that slower plan. Interval durations are bounded server-side at 10 seconds minimum and 24 hours maximum; the ceiling is a day because "leave it running overnight and show me what happened" is the longest question this tool is for. - Sample interval: Auto or a preset. A cadence the server cannot keep is adjusted, and the caption says which limit bit: the 500-samples-per-pair ceiling, or one round over this many pairs cannot finish faster.
- Plane: fixed at
pod. Definitions and runs probe from the pod network; this release ships no second plane, so the field states the scope rather than offering a choice.POST /api/v1/runsanswers any plane other thanpodor empty with 400invalid plane. - Destination: Nodes (node picker), Target (a saved external target), or Ad-hoc (a typed address). A run to a Target or an Ad-hoc address takes
tcp,icmpormtronly, the types an agent runs against an external destination. Ad-hoc labels adapt to the check type:tcptakeshostorhost:port(port defaults to 80), andicmpandmtrtake a host only.dnsandhttpone-off runs cannot go external; the form points you at saving a definition instead, which is the continuous external checker.udpandpmtuprobe kconmon nodes only, as a run or as a saved definition: they speak the kconmon echo protocol, which no external host answers, so any other host would read as 100% loss. For all four types the form tells you why Start run would be refused, and the API answers such a run with 422invalid destination, whose detail gives that type's reason (the controller'sPOST /api/v1/diagnosticsanswers the same request with 400). An ad-hoc address is at most 2048 bytes and a node name at most 253; the API answers a longer one with 400. - Sources / Destinations: node pickers, with "All nodes ({count})" as the default and an All ↔ All reset.
External destinations must also be allowed fleet-side: checkers.external.enabled plus allowedCidrs (see Configuration), and the cluster must let the packet out.
Save as definition stores the current form as a reusable check definition. It is saved enabled and probing from all agents, which means it starts costing metric series immediately; edit it afterwards on Scheduled checks, where the series-projection guard also lives.
Will a big run melt an agent?
No. Read the throttling model before you point 400 pairs at a small fleet anyway.
The form shows a live "~{count} pairs" estimate, and a run fans out to at most 400 pairs, enforced server-side on the raw sources×destinations product; anything above is refused up front, and the form warns before you try. Within a run, the dispatcher keeps at most 8 probes in flight, and at most 2 of them against any one source agent. That per-source bound sits deliberately under the agent's own on-demand task semaphore, so a run can never win the race against it: the agent refuses overflow outright rather than queueing it, and a run that raced would turn refusals into failed results.
Each dispatched pair gets a timeout, clamped between 1 s and 120 s, with three raised floors:
- MTR pairs get at least 90 s. A trace walks up to 30 hops in sequence and may first wait behind the agent's semaphore; a shorter deadline gives up on work that is still running.
- UDP pairs get at least 5 s. The UDP probe waits out a full read deadline per lost packet, so its worst case is packets × timeout: 1.25 s with the chart's defaults, already past the general 1 s floor. A pair losing every packet is exactly the pair the run was started to look at, and without this floor it would come back as "dispatch timed out" instead of "100% loss": the measurement replaced by a report that the machinery gave up.
- PMTU pairs get at least 15 s. On a black hole the search waits out one datagram timeout per lost datagram: both full-size attempts, up to 16 bisection steps and two confirmation sends, about 10 s at the shipped 500 ms. A shorter deadline cancels the search midway, and the pair reads unreachable instead of the black hole the run was started to find.
The run permalink
Every started run lives at /diagnostics/runs/<id>: the spec (Type, Plane, Pairs, Started), a live summary (Duration, Cadence (planned vs measured), Sent, Failed, Min, Avg, p95 / max), a Live badge while results are arriving, and a Cancel run button while it is in flight.
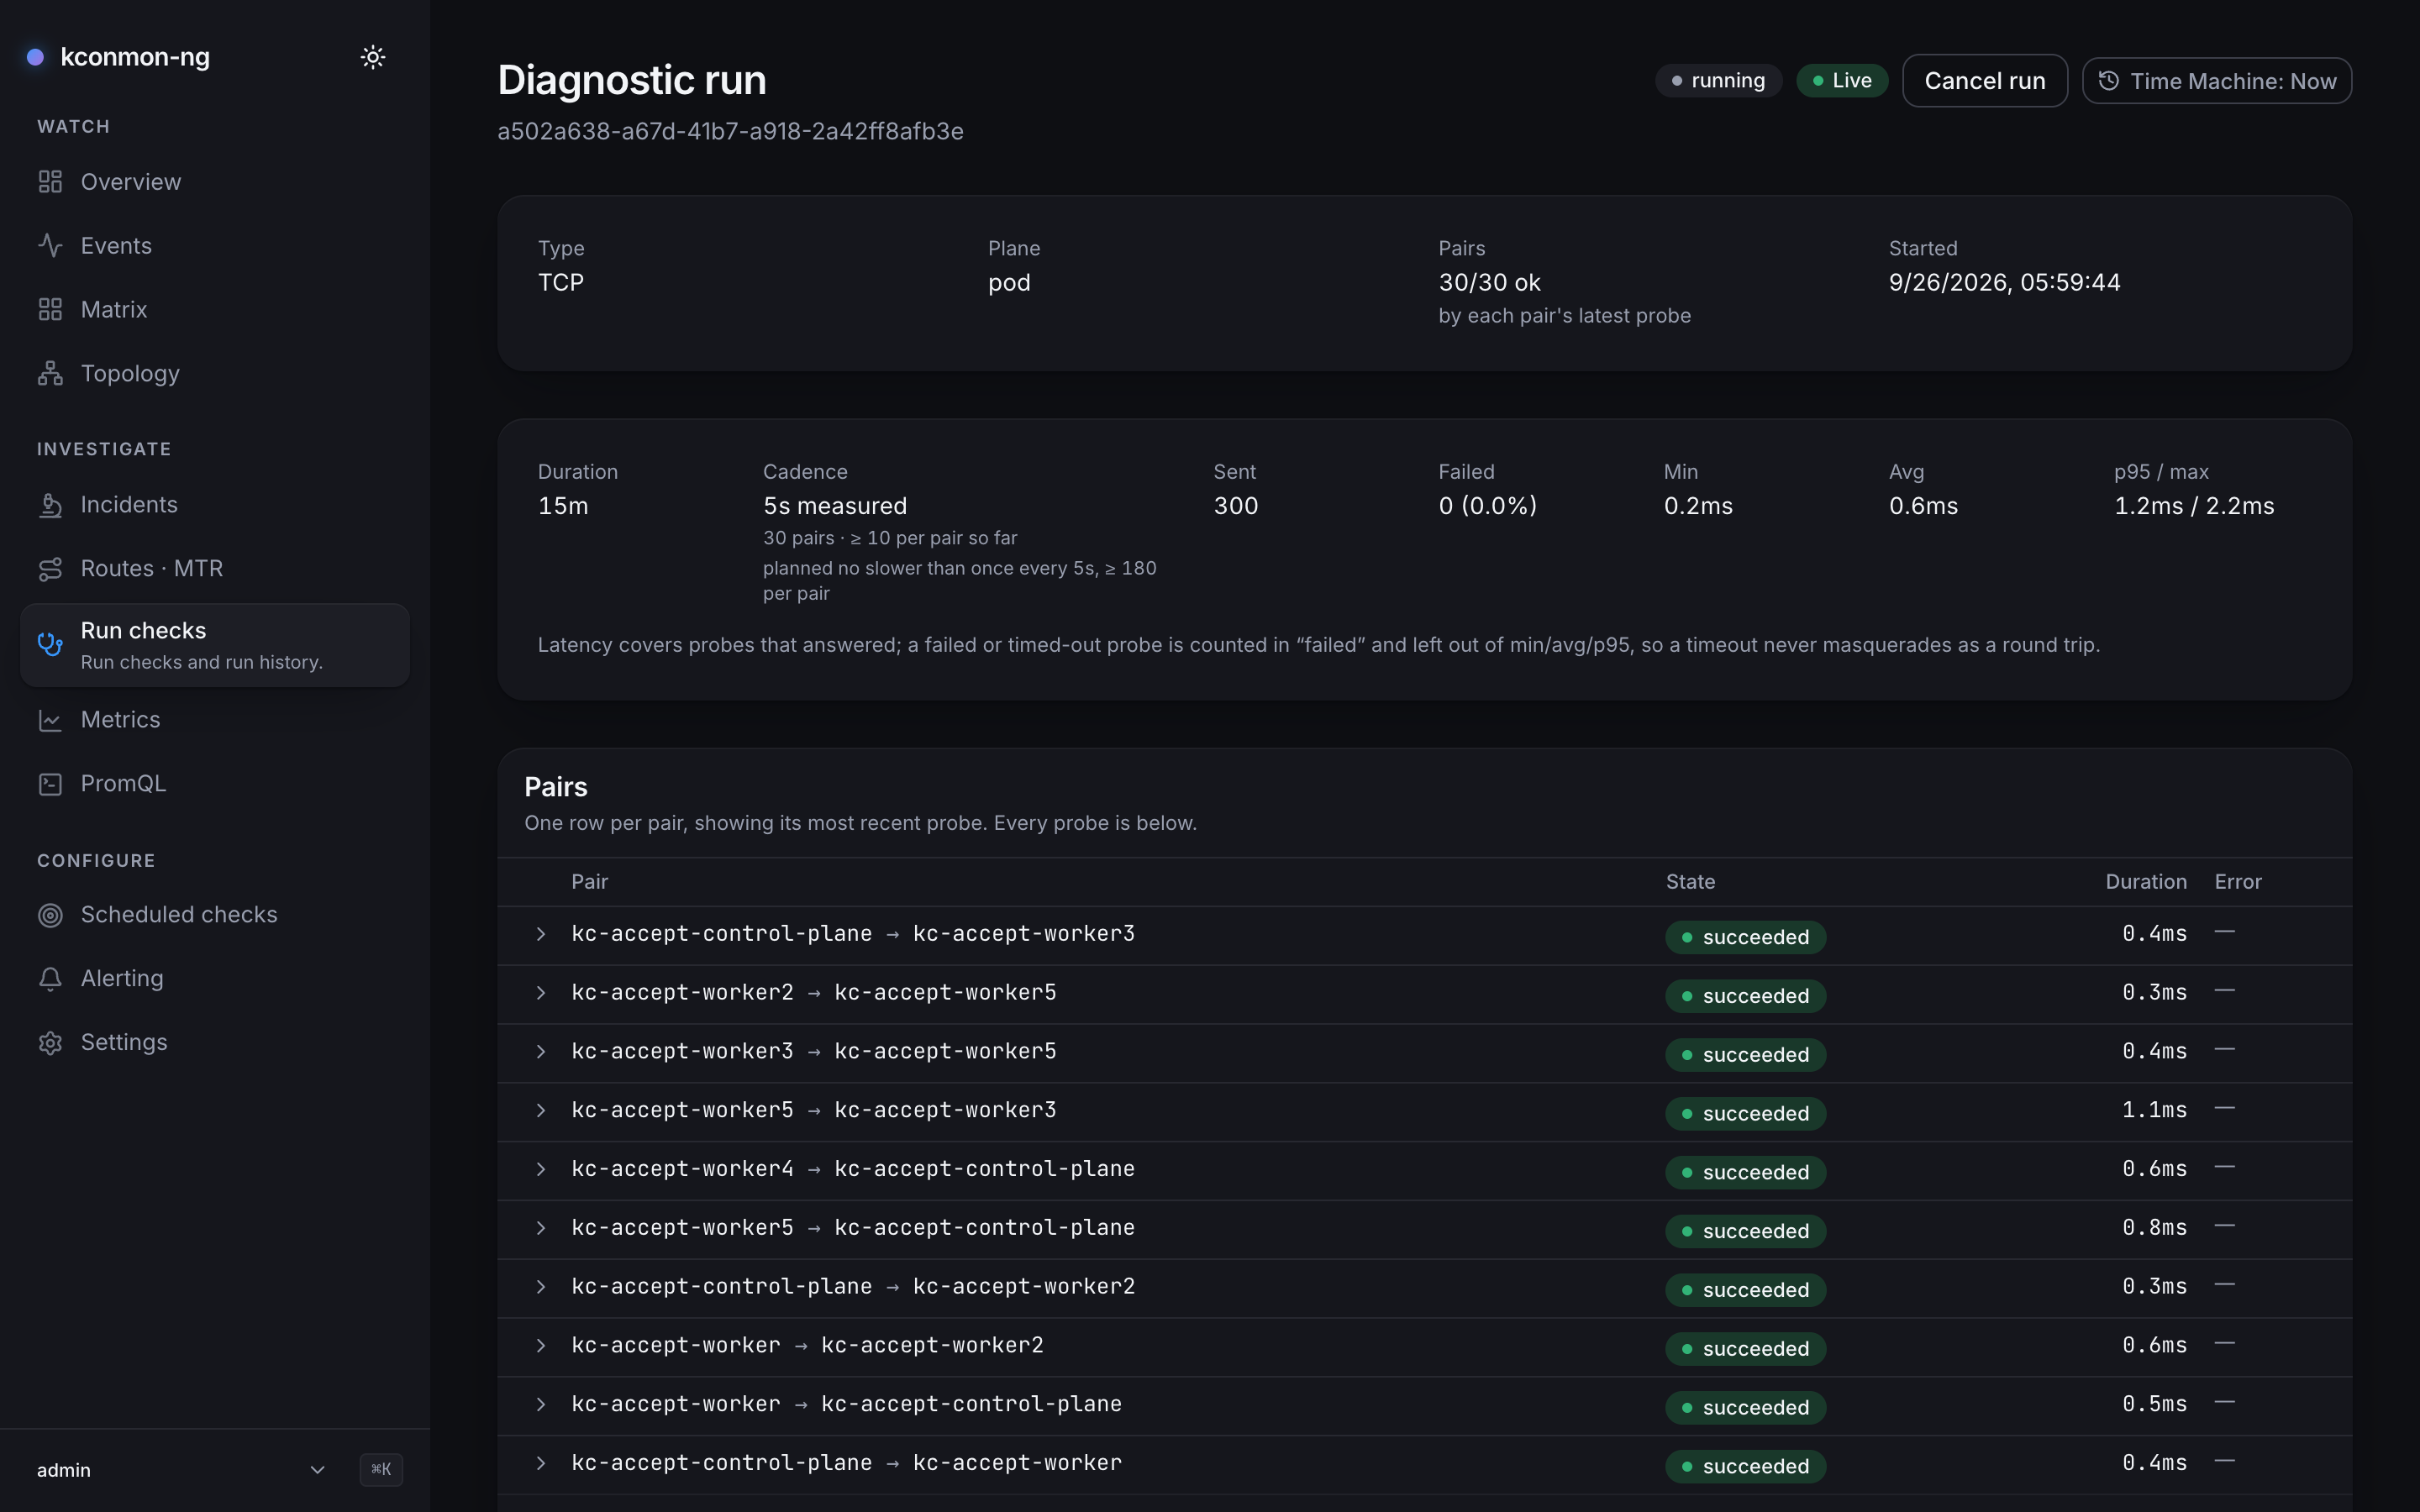
The Pairs table shows one row per pair with its most recent probe ("{ok}/{total} ok"). Failed pairs come first, then the ones still in flight, then the rest, each group in arrival order, so the first page of a 90-pair run shows what broke. Expanding a row opens the pair's own record:
- A probe timeline. Interval runs draw each pair's probes as ticks on a strip. On an MTR run a tick is clickable ("Show the route this probe took") and opens that probe's route panel, headed "Probe #{seq}". The hops shown belong to the route, folded over every trace that walked it, so while the route holds, consecutive probes read the same, and the panel says so rather than letting a strip of identical hop tables read as a stuck control. A probe that failed walked no route at all and says that instead. When several recorded routes cover one probe, because the pair alternated between paths (ECMP, for example), the panel says so and does not pick one of them as the route the probe walked. On an MTR run the expanded row shows the route the pair's latest probe in this run walked, not the pair's current route. A pair whose latest probe failed says it recorded no route, one whose probe no stored route covers says that, and one whose latest probe several routes cover says that too. On a running run a new probe usually lands before its trace reaches the route history: the row then asks the history again, once per probe, and keeps the route it showed for the previous probe until the answer comes, while a clicked tick shows a placeholder. A probe the history still does not cover after that says so. Recorded routes carry an Open in MTR Explorer link into path history.
- A truncation notice, when it applies. A long interval run records more results than one response can carry (2 000), so the page shows the newest slice and states it: "Showing the {count} most recent results — this run recorded more than one page can carry, so the figures above describe that slice, not the whole run." Without that line the summary would be a wrong number wearing a right one's face.
- For non-MTR pairs, the sample's own facts: source, destination, duration, state, and the agent's error sentence in full where there was one. A
pmtupair adds Verdict (full size, reduced, black hole, or unreachable: no size crossed reliably, which is not an MTU verdict), Path MTU ("{mtu} of {probe} bytes", marked at least when the search stopped at its time budget; absent on unreachable) and Datagrams, the number of datagrams the search sent. An unreachable pair's error says why: the peer's echo did not answer 64 bytes, the time budget ran out before any size above 64 crossed, every size tried above 64 was lost, the found size crossed once and was lost when sent again, or the probe stopped on an error before a verdict.
Run history
Past runs list under the form with server-side type and status filters and a Load older button; once there are no older runs, a muted "No older runs." takes its place. History needs the database; without one the page says "History is not persisted". When the console cannot read its own configuration (GET /api/v1/config failed), that line says "Could not read the console configuration, so whether history is kept is unknown: {error}" instead. When the first page for a filter fails to load, the old rows are cleared and an error line with Retry takes their place, with no "No runs yet" or "No runs match these filters" slate under it. Under the Time Machine, history is cut to the viewed instant client-side, and the page states the bound: GET /api/v1/runs has no time filter, so the cut happens over the loaded pages.