Matrix
The N×N connectivity heatmap: one cell per directed pair, source rows × destination columns, the corner header reading src \ dst. When one node's row or column lights up, you can tell a source-side problem from a destination-side one at a glance.
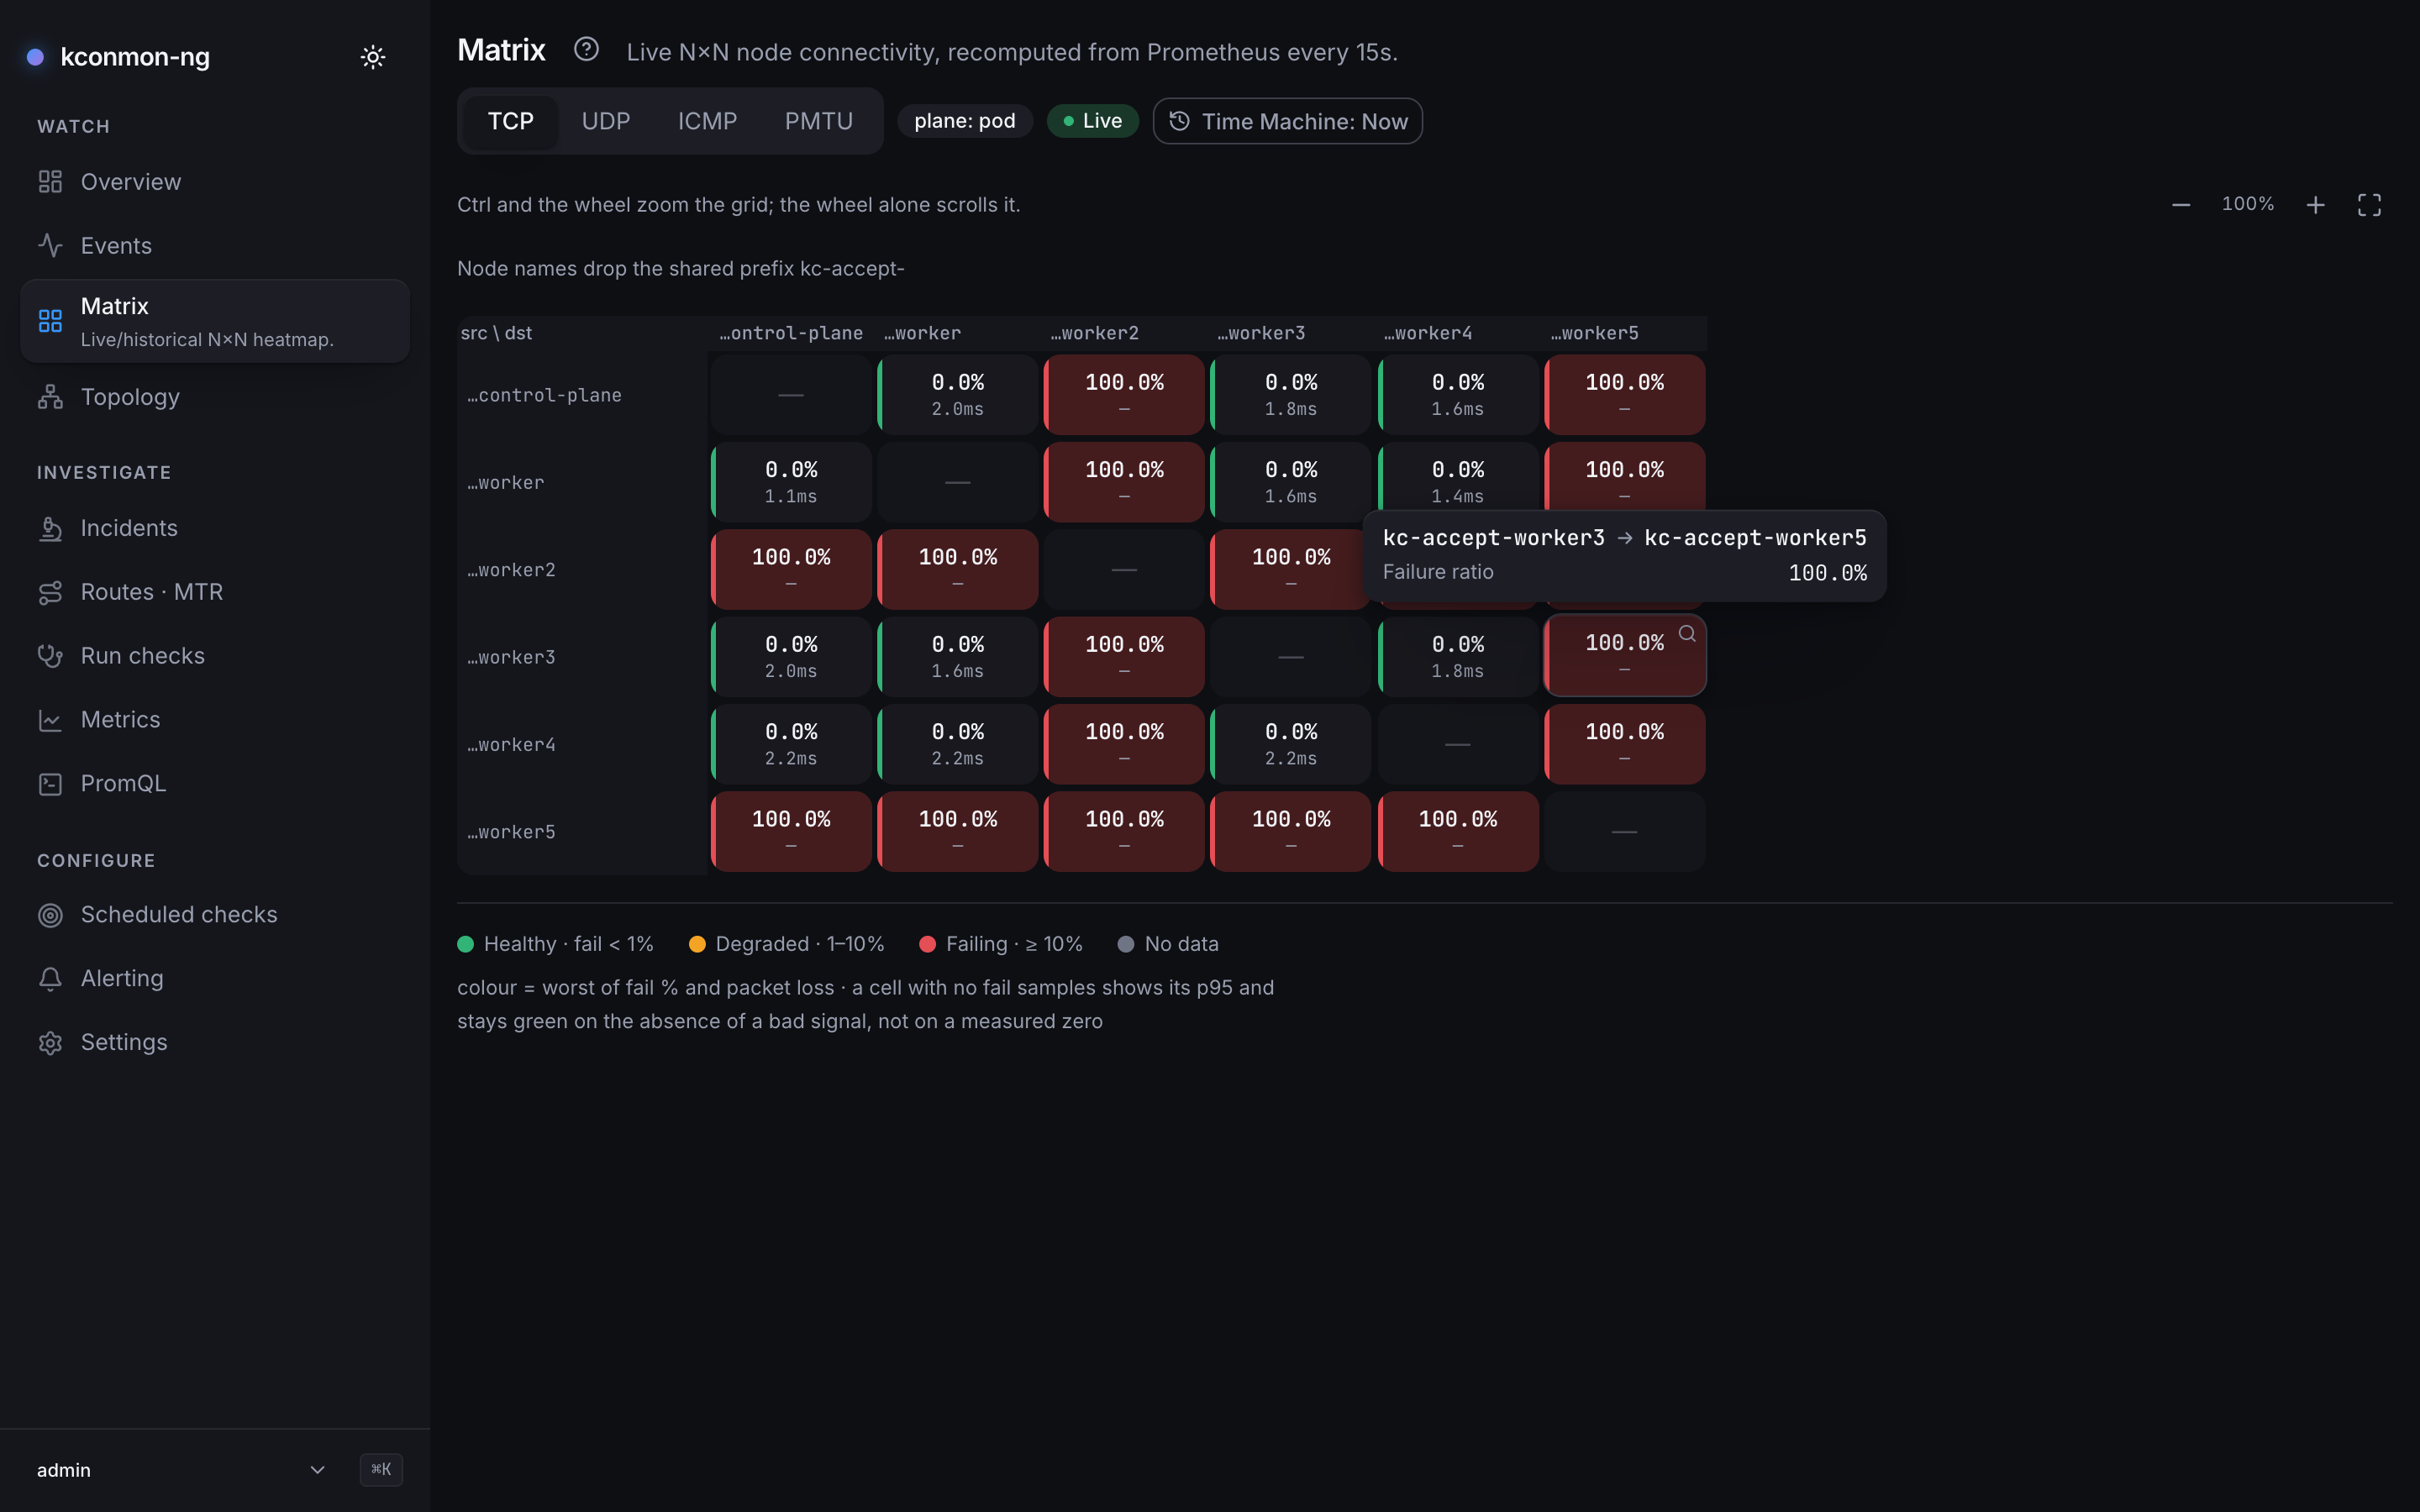
Reading the heatmap
Each cell prints the pair's failure percentage and, under it, its p95 RTT. Packet loss is not printed in a cell that has a failure ratio, even a red one; hovering opens a tooltip with Failure ratio, RTT p95 and, where measured, Packet loss. A cell with an RTT but no failure series yet prints the p95 as its main figure and "loss {ratio}" under it on UDP and ICMP ("no fail data" where no loss gauge exists either).
Colour is the worst of failure ratio and packet loss:
| Colour | Meaning |
|---|---|
| Green | Healthy · fail < 1% |
| Amber | Degraded · 1–10% |
| Red | Failing · ≥ 10% |
| Grey | No data: nothing probed this pair |
This page is the canonical home of the console's no-data rule, which every other surface links back to: silence is never rendered as a zero. A pair nothing probed is grey and reads "no data". A pair whose failure counter emitted no samples while its RTT did is a different fact: the cell keeps its p95, its second line reads no fail data, and it stays green on the absence of a bad signal rather than on a measured zero. A tooltip on such a cell says "no samples" where the ratio would go. The same two readings appear on the pair and node pages and feed the measured/scored split on Overview.
Controls
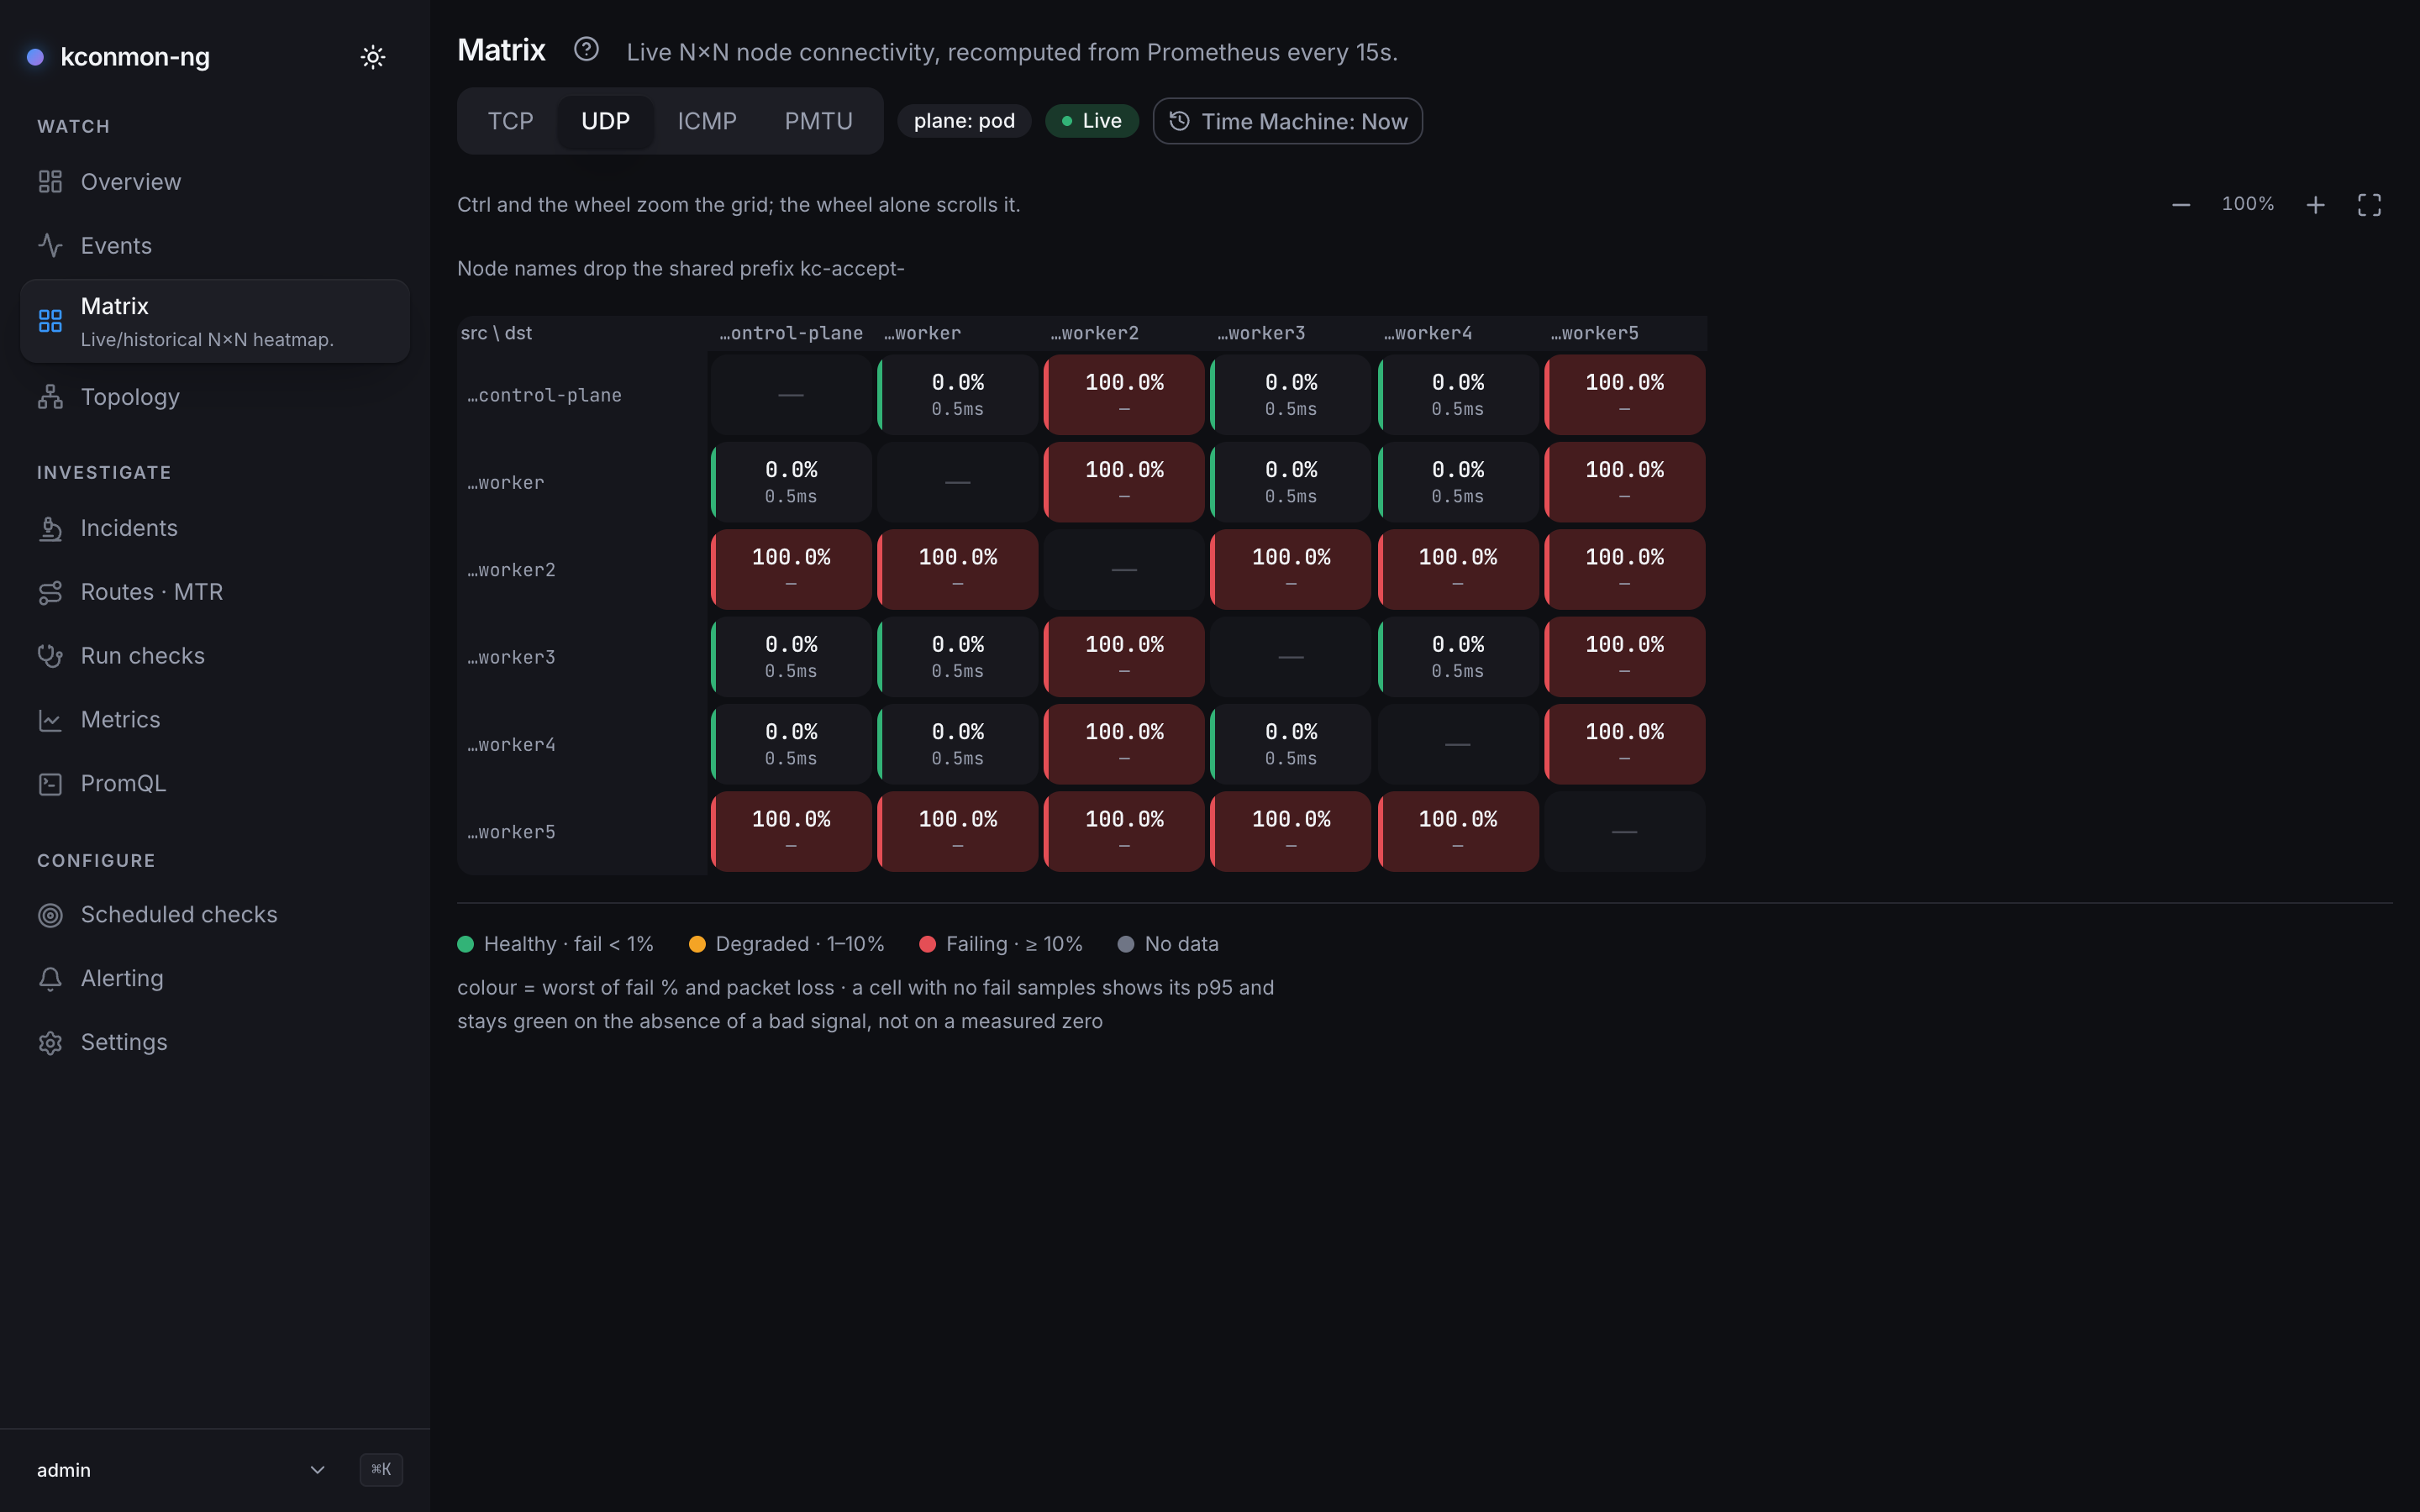
- Protocol switch: TCP, UDP, ICMP, PMTU. The choice travels in the URL (
?protocol=), so a matrix view is shareable as it stands, and?protocol=udpin a pasted link selects UDP on arrival. - Zoom cluster: Zoom in, Zoom out, Fit to view, with the current level shown as a percentage. Ctrl plus the mouse wheel zooms the grid; the wheel alone scrolls it. Zoom walks fixed steps from 40% to 150% rather than a continuous scale, so a size you liked is a size you can get back to. The 40% floor is deliberate: below it a cell is smaller than the smallest legible figure, and shrinking further would trade a grid you cannot fit for a grid you cannot read. At the floor the container pans instead, and each cell becomes a plain tile: no figure and no search icon, only the tier's colour, a strong amber or red for degraded and failing pairs and a quiet green for healthy ones. The figures stay in the tooltip, and a tile still opens its pair.
- When all node names share a prefix, the grid drops it and says so ("Node names drop the shared prefix …"). A label still too long for its header after that is cut from the start, not the end, so it keeps the tail that tells nodes apart ("…ker2"); the full name is in the tooltip.
The PMTU protocol
Since 2.5.0 the matrix can show the path MTU plane. A cell's figure is the largest datagram in bytes that crossed the pair on the last probe, and the line under it says what that means:
- full size on a green cell: the datagram at the source's probe size crossed.
- of 1500 (the size the source probes this pair at) on an amber cell: the path is smaller and says so with ICMP. Nothing is lost; TCP adapts, UDP without its own path MTU discovery does not.
- black hole on a red cell: full-size datagrams vanish without an ICMP error. The cell turns red from the first failed probe that found a size below the probe size, without waiting for the 5-minute failure ratio to reach 10%.
- recovering on an amber cell at full size: the probes of the last 3
minutes crossed clean, and the failures are older, still inside the
5-minute window. The cell stays amber until they leave it. While any probe
of the last 3 minutes still fails, a full-size cell stays red as a black
hole: every probe opens a fresh socket, so a black hole on one of several
ECMP paths keeps failing some of them while the size flips between probes.
With no probe in the last 3 minutes (
checkers.pmtu.intervalabove about 3m) the cell never reads recovering, and the 10% failing line alone makes it a black hole. A reduced cell with failures stays a black hole until the 5-minute window is clean.
The legend rows read Full size, Reduced or recovering and Black hole. A
pair with no pmtu verdict in the last 5 minutes (every probe came back
unreachable) reads no data rather than its last size, live and under the Time
Machine alike. An agent that lists its planes without plane:pmtu (2.4.x, or
checkers.pmtu.enabled: false) gets a row that reads "the source does not run
PMTU probes" instead of an empty cell. The walkthrough is
Catch an MTU black hole.
Cell states
- Diagonal: "{node}: self"; a node never probes itself.
- Measured cell: click to open the pair's pair page. A search icon in the cell's top-right corner, shown on hover or keyboard focus, opens Incidents scoped to that pair ("Investigate {src} → {dst}").
- Unmeasured cell: "No probe data in Prometheus for this pair."
- Not probed: a dashed hollow box, "not probed by the topology plan", for a pair a sparse plan (
topology.mode: sparse, since 2.3.0) deliberately leaves out. The legend row "Not probed · excluded by the topology plan" appears only while a plan is in force. - Row/column header: click to open that node's node page.
Both kinds of link carry ?at= while the Time Machine is engaged.
Silence with a known cause
Since 2.4.0 the grid tells two more kinds of silence apart from plain no-data. Neither is a new colour: the console never turns an absence into a verdict, so these are hints about why a cell is empty, decided from the topology snapshot and applied only to cells that carry no measurement (a measured cell always shows its measurement).
- Unscraped external agent. An external agent whose name is never a cell's source while the grid has cells at all is a bare host Prometheus is not scraping: the cluster probes it (its column fills in) but nobody reads its own probes (its row is empty). Those cells keep the no-data fill, the dash placeholder and the same screen-reader reading, because that is what they are; only the tooltip changes, to "No series from {src}: Prometheus is not scraping this external agent's metrics port. Add a scrape job — see External agents docs." A note above the grid, beside the shared-prefix note, lists the unscraped agents by name and carries the link to Scraping external agents. Both disappear the moment the source has a single measured cell.
- A plane the source does not run. An agent advertises the probe planes it runs (
plane:tcp,plane:udp,plane:icmp, and so on) at registration. When the grid's protocol is one the source left out, its cells render like not probed (a dashed hollow box), the tooltip reads "{node} does not run {protocol} probes", and a legend row "Not run · the source does not run this protocol's probes" appears while at least one such cell is on the grid. The rule is fail-open: an agent that advertised no plane at all (every agent older than 2.4.0) is read as running every plane, never as unsupported, so a rolling upgrade cannot turn grey cells into calming dashed ones. It is decided per source only; the destination's planes are not consulted. - Precedence when a cell has no data: excluded by the plan, then unsupported, then unscraped. The plan is the operator's own statement and outranks what an agent advertised.
- External headers. The row and column header of an external agent adds "external agent" as the second line of its tooltip, and its screen-reader label reads "Open the card for {node}, external agent".
Where the grid comes from
The header also shows a plane: pod chip. It states which network plane these probes travel: the pod network, the only plane this release ships (the Plane field on Scheduled checks is the same fact from the configuration side; the API answers 400 for any other value).
Live, the grid arrives two ways. On a replica receiving the controller event stream, whole matrices are pushed over the WebSocket as snapshot frames on the topic matrix:<protocol>:pod; every frame carries the complete grid, so a reconnect needs no replay. Without the stream, the page polls GET /api/v1/matrix every 15 seconds; either way each update replaces the grid wholesale, and the server computes it from Prometheus. Concurrent callers share one computation per protocol, and the server serves it for up to 5 seconds; a Prometheus failure is not cached. With the Time Machine engaged, the page skips that endpoint and evaluates the same PromQL directly at the viewed instant.
When series are missing
The cardinality valve that arrived in 2.3.0 (agent.metrics.detail in charts/kconmon-ng/values.yaml) is a scrape-time relabeling, and this grid reads Prometheus, so the valve decides what a cell can show:
counters-onlydrops the four per-pair histograms (TCP connect, TCP total, UDP RTT, ICMP RTT). Every cell's p95 line goes dark while the failure percentage and loss survive, since counters and gauges stay. A grid that is coloured normally but shows no RTT anywhere is this mode, not a bug.zone-onlydrops every series naming a destination node. The whole per-pair mesh blanks: every cell grey, "no probe data". The zone-level families the mode keeps are not drawn here.
A dark p95 column usually gets diagnosed on this page first, which is why the note lives here; Overview and Metrics describe the same modes from their side.