Alerting
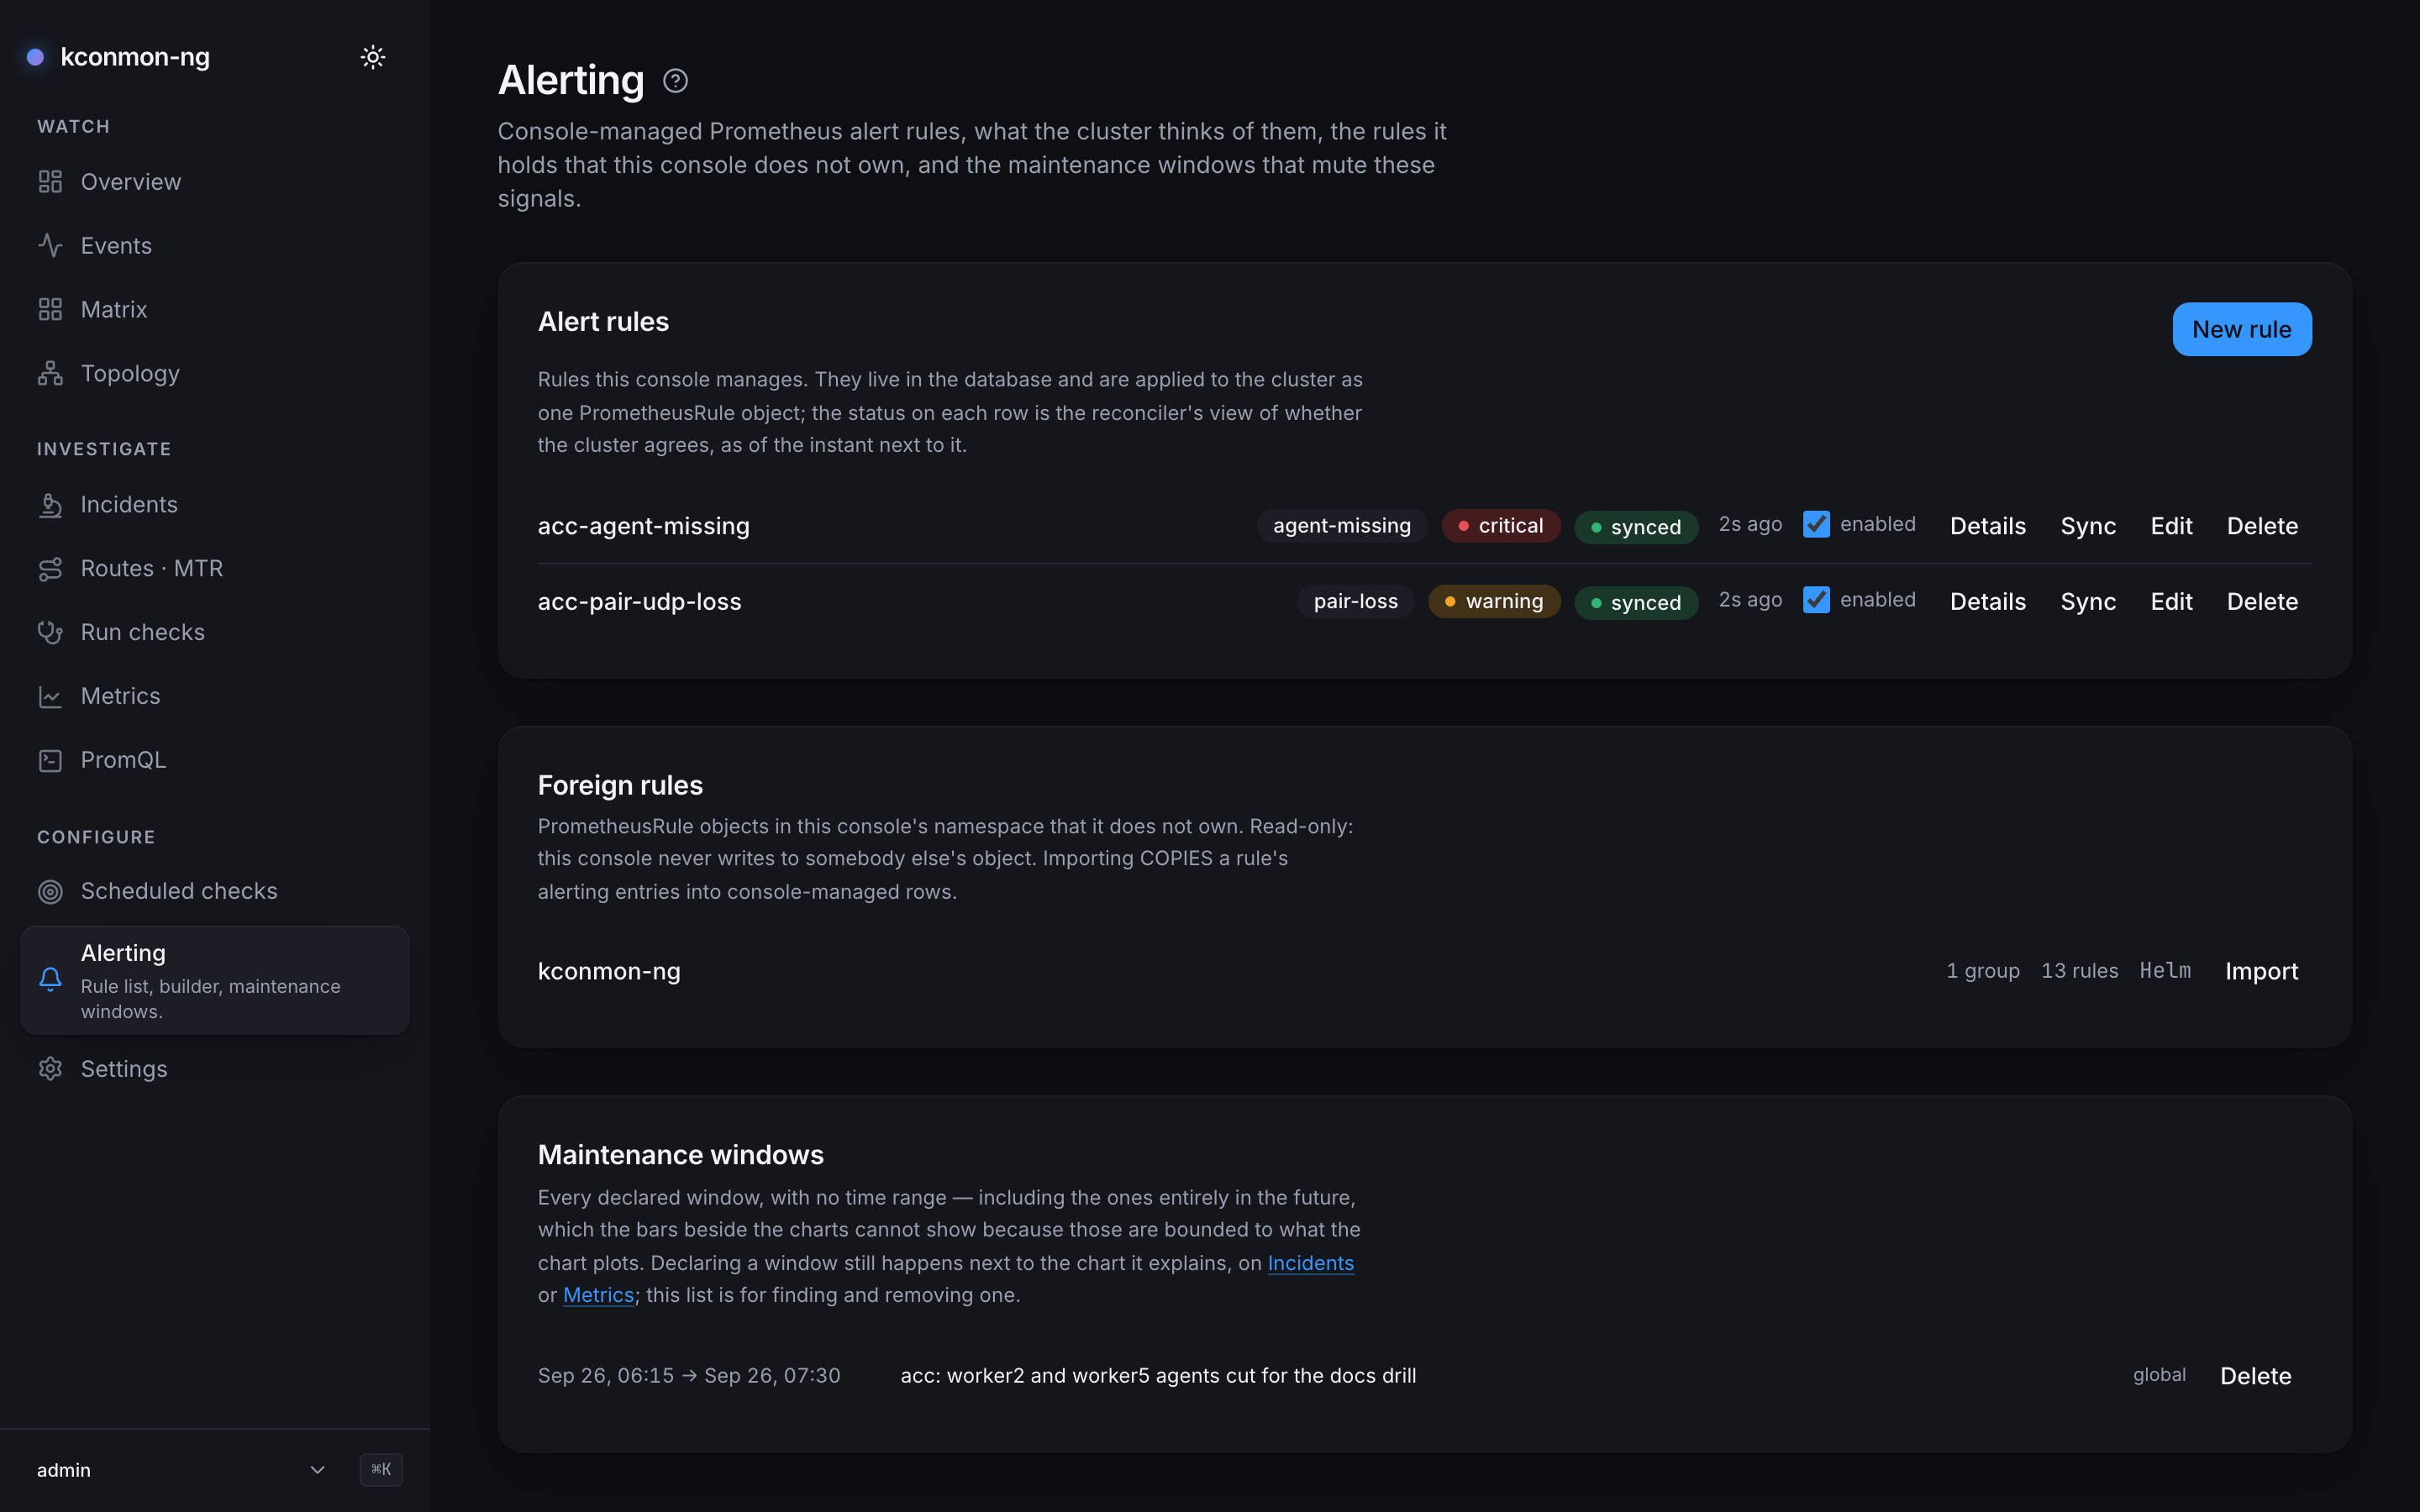
Console-managed Prometheus alert rules: packet-loss and latency alerts without writing PromQL, plus the cluster's view of them. Three sections on one page: Alert rules, Foreign rules, Maintenance windows.
Reading needs alerts:read, which every built-in role holds. Managing rules needs alerts:manage, held by operator, alert-editor and admin; viewer reads only. (The alert-editor role exists for exactly this page; alerting is its charter.)
How rules reach the cluster
Rules live in the console database. A reconciler renders every enabled rule and applies the result to the cluster as one PrometheusRule object, named by console.alerting.bundleName (default kconmon-ng-console-rules), in console.alerting.namespace (empty means the release's own), all rules in a single group kconmon-ng-console, labelled app.kubernetes.io/managed-by: kconmon-ng-console. The apply is a server-side apply under that same field manager, forced, which is correct precisely because the object is the console's end to end.
That label is also how the console knows the object is its own. Since 2.5.0 it never applies over or deletes a PrometheusRule named bundleName that does not carry app.kubernetes.io/managed-by: kconmon-ng-console. On such a name collision the foreign object is left intact and every enabled rule shows sync status error with other: PrometheusRule <namespace>/<name> exists and is not the console's (...), so the console leaves it alone; set console.alerting.bundleName to a name no other PrometheusRule in the namespace uses. The chart refuses a bundleName equal to its own PrometheusRule's name (the release fullname) while prometheusRule.enabled is on.
The console's alerting Role in that namespace grants list on PrometheusRules, and get, create, patch and delete only on the one named bundleName. create can be scoped by name because the console creates the object with a server-side apply, which names it.
The whole machinery is off by default (console.alerting.enabled), because enabling it lets the console write a cluster object. With it off, rules still save to the database and sync actions answer "Prometheus rule sync is disabled".
When on, the reconciler runs immediately at startup, then on every console.alerting.syncInterval (default 60 s, jittered ±20%), and on every kick: saving a rule nudges it without waiting out the loop, and Sync now on a row requests a pass the same way. With several console replicas, one pass runs at a time behind an advisory lock.
Sync status
Each rule row shows its enabled state and the reconciler's verdict as of the stamped instant:
| Status | Meaning |
|---|---|
| unsynced | Not yet applied. Every freshly created or edited rule starts here; it is not an error. A rule edited while a pass is applying stays here until the next pass applies the edit. |
| synced | The cluster object matches this rule. |
| drift | Past tense: the cluster had diverged as of the stamp, and the pass corrected it. A reconcile always re-asserts the console's bytes, so drift never means "diverged right now and left alone". |
| error | The last reconcile failed; the row carries the message, whose first token is a cause class: crd-missing (the Prometheus Operator CRD is not served), forbidden (the ServiceAccount may not write PrometheusRules), or other. The first two are fixable by applying a manifest, which is why they get names. |
Drift is detected mechanically: each pass fetches the live object, diffs it against what the console would render, records the difference on the affected rows, then applies regardless.
When the cluster refuses the object's content (a 400 or 422, which is also how an admission webhook's denial arrives), the pass does not let one bad rule take the bundle down. It re-applies the last set that did apply, read back from the live PrometheusRule on every pass, so with several console replicas it is the set the cluster holds rather than the one this replica last wrote. The rules added or changed since carry the error "this rule was refused by the cluster and is not deployed", with the API's own words after it. A transient failure (an apiserver timeout, 429, a 5xx, an unreachable webhook) quarantines nothing and never deletes the live PrometheusRule: every rule shows the error, and the next pass retries.
Two enabled rules whose names become the same Prometheus alert name (see the rule builder) do not stop the bundle either. Such a pair can exist when an older version saved it, or when two writes raced. The rule already deployed under that alert name keeps it, else the least recently updated one. The other shows error with alert name collision: "pair-loss" and "pair.loss" both sanitize to "PairLoss"; rename this rule and stays out of the bundle, while every other rule, disables and deletes included, still reaches the cluster.
Row actions: Details (rendered expression, for duration, last-applied stamp), Sync now, Edit, Delete (with confirm). On a narrow screen they wrap onto their own line under the rule instead of pushing the page sideways.
The rule builder
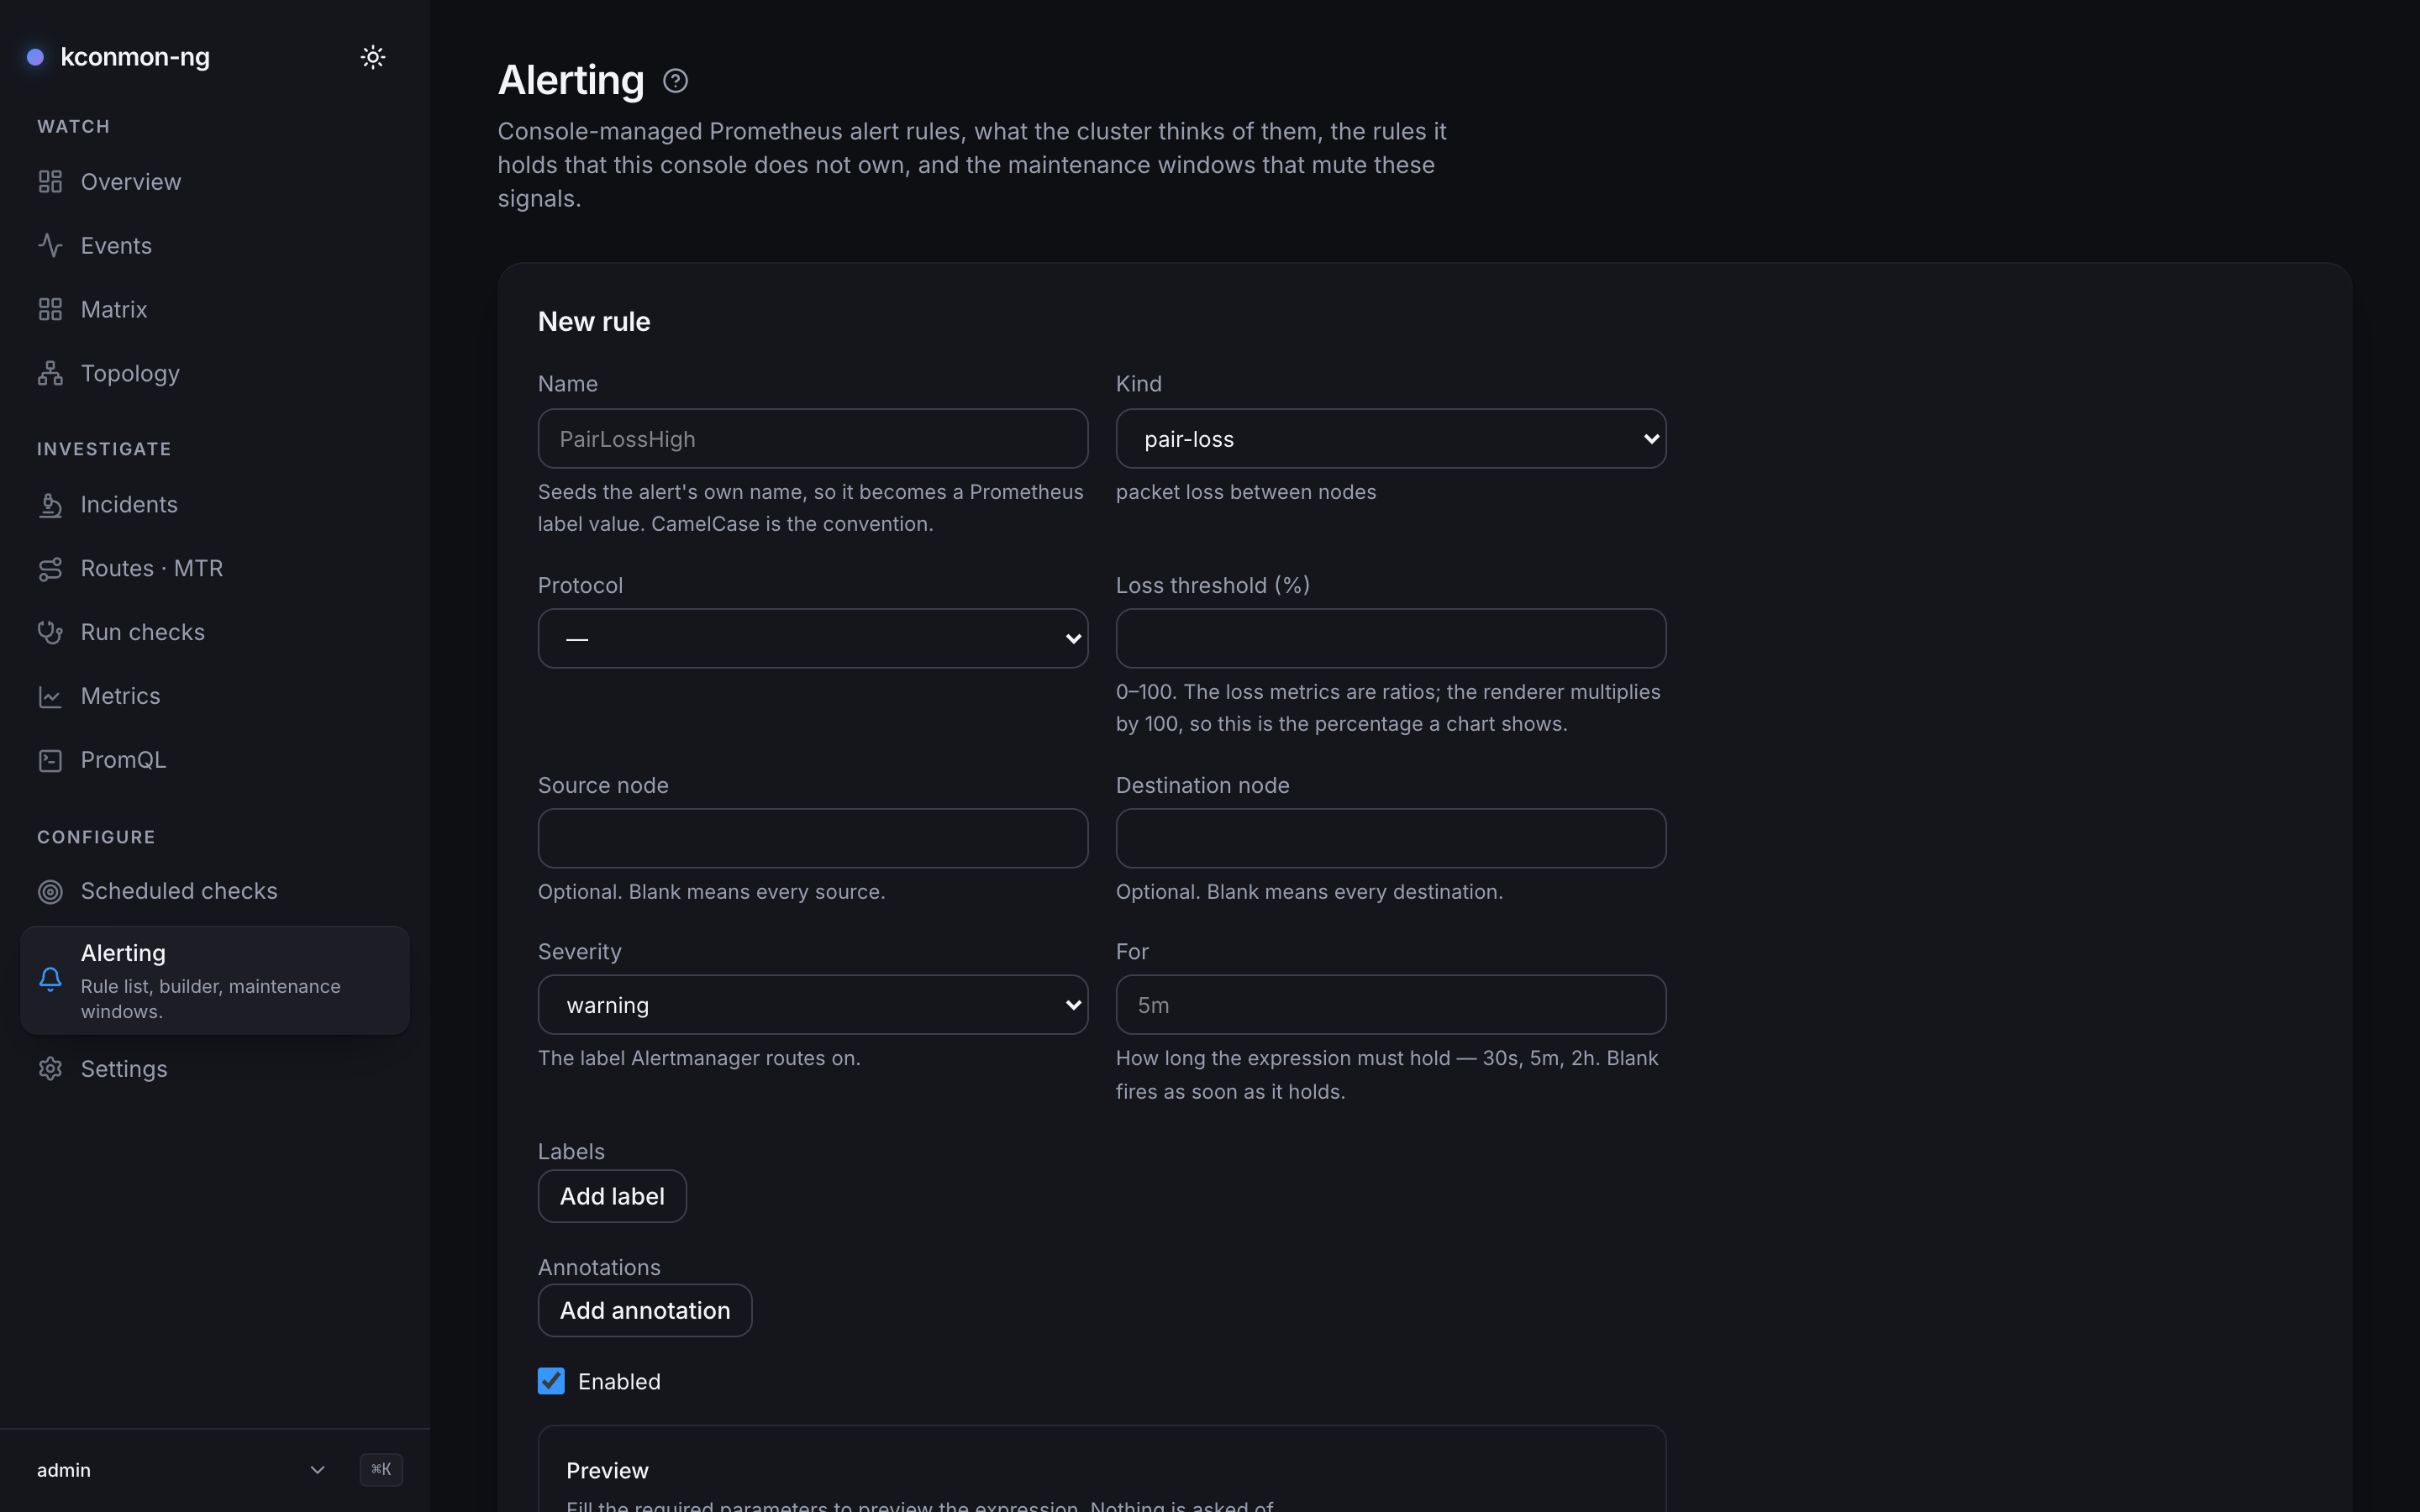
for, and the labels and annotations editors, each field explaining itself in a line underneath.New rule opens the builder, a card as wide as the page with its fields at reading width. When the server refuses a save, focus moves to the refused field, or to the save button when the refusal names no field. A blank Name is refused in the browser with "A name is required." before anything is sent. Name seeds the alert's own name, so it must fit in a Prometheus label value (1–63 bytes); CamelCase is the convention. The alert name is the rule name with every character outside [a-zA-Z0-9_] dropped, and with its first letter and every letter after a dropped character upper-cased, so pair-loss, pair.loss and PairLoss all become PairLoss. Since 2.5.0 a name whose alert name another rule already has is refused: with 422 on create and update, and as a per-rule failure or skip by a settings import or a foreign-rule Import. The message reads name "pair.loss" becomes the Prometheus alert name "PairLoss", which alert rule "pair-loss" already has; choose a name that differs in more than case and punctuation. An edit that keeps a rule's alert name is not checked, so a clash an older version let in can still be edited, disabled or renamed away. Severity (info / warning / critical) is the label Alertmanager routes on; a fourth value would route nowhere. Extra Labels and Annotations land on the rendered alert, with two reserved names: severity and kconmon_ng_rule_id are stamped by the renderer, and supplying either is an error rather than a silent override.
For takes Prometheus duration grammar: a number and a unit (30s, 5m, 2h), units ms s m h d w y, composites running largest unit to smallest (1h30m). Blank fires as soon as the expression holds. The ceiling is about 292 years, which is not a round number and not the console's: it is where an int64 of nanoseconds ends, which is what Prometheus stores a for in.
Rule kinds and their parameters
Each kind is a template the server renders into PromQL; the parameter set per kind is closed, and an unknown key is a 422, never a default. Every rate() below runs over a 5-minute window.
| Kind | Parameters | Renders as |
|---|---|---|
pair-loss |
protocol (tcp/udp/icmp), thresholdPercent (0–100), optional scope object with sourceNode, destNode ("scope": {"sourceNode": "…", "destNode": "…"}; flat keys are a 422, unlike zone-latency's flat sourceZone, destZone) |
UDP/ICMP: the packet-loss ratio gauge × 100 > threshold. TCP has no loss gauge (a connect probe sends no packet stream), so its loss is the failed share of tcp_results_total: 100 × rate(fail)/rate(all) > threshold, grouped per pair and zone. |
zone-latency |
protocol, quantile (0.5/0.95/0.99), thresholdMs (> 0), optional sourceZone, destZone |
histogram_quantile(q, …) over the protocol's RTT histogram, grouped by zone pair, × 1000 > thresholdMs; the histograms are in seconds, and the renderer converts so the threshold stays in the units the form asked for. |
dns-failures |
thresholdPercent (0–100) |
Failed share of dns_results_total, grouped by host, resolver and source, > threshold. |
http-ttfb |
thresholdMs (> 0), optional url |
histogram_quantile(0.95, http_ttfb_seconds_bucket) (the quantile is fixed) × 1000 > thresholdMs, grouped by URL and source. |
agent-missing |
none (the form says so: how long the condition must hold is the rule's own for) |
The chart's KconmonAgentsMissing expression: expected_agents minus the registered in-cluster agents (registered_agents less external_agents) > 0, only where controller_leader == 1. External agents cannot hide a missing node, a standby controller does not fire it, and $value is the number of missing agents. A rule of this kind saved before 2.5.0 takes the new expression on the next sync. |
external-target-down |
optional targetName |
rate(external_results_total{result="fail"}) > 0 per target and source. A probe the allowlist refused increments a separate denied counter, so refusals never fire this. |
raw |
expr |
Stored verbatim, whitespace included; validity is what the preview reports. Prototype on the PromQL page first. |
The Preview panel renders the expression and evaluates it: "Matches {series} series right now". Zero gets its own sentence saying that is the answer, not a failure. An expression Prometheus refuses blocks saving, because a bad entry in the bundle would stop the other rules from being applied too; the same check runs server-side at write time, so an unrenderable rule is a 422 naming the parameter instead of a stored row that fails a minute later.
Foreign rules
PrometheusRule objects in the console's namespace that it does not own. Read-only, since the console never writes to somebody else's object, with an Import action that copies a rule's alerting entries into console-managed rows. Import takes two presses: Import arms the row, which then offers Confirm import and Cancel, and a screen reader hears "This creates {count} enabled console rules next to the originals." Nothing is copied until Confirm import. Every adopted rule arrives as kind raw with the foreign expression verbatim, and the original object is untouched; the page warns that the same alerts then exist twice until their owner removes theirs.
Maintenance windows
The full list of declared windows, entirely-future ones included: the only unbounded view of them in the console, since the bars beside the charts are cut to what the chart plots. Declaring a window still happens next to the chart it explains, on Incidents or Metrics; this list is for finding and removing one, and managing it needs maintenance:write.
Since 2.5.0 an open window also holds back the console's alert webhooks in its scope (below). A global window holds every one of them, cluster-wide. Windows declared from Metrics, or from an investigation of a zone pair or the whole cluster, are global, and the create form says so. Windows declared before the upgrade start holding webhooks as soon as the 2.5.0 console runs, so review this list for long open or future global windows before you upgrade.
Webhooks
With alerting and webhook endpoints both configured, the console polls Prometheus alert state every console.webhooks.alertPollInterval (default 30 s) and delivers the edges as alert.fired / alert.resolved. A failed poll freezes the firing set: nothing resolves while Prometheus is unreachable. An open maintenance window holds back the alert.fired and alert.resolved deliveries of every alert whose labels its scope covers (the whole console, one of the alert's two nodes, its directed pair, or its external target). If the window closes while the alert still fires, alert.fired goes out then, with the original firedAt; an alert that starts and resolves inside the window sends nothing. Alerts that were already firing when the window started, or when it was declared, keep their alert.resolved. A console restarted inside a window keeps holding the alerts that began inside it: it counts an alert as begun inside a window when the alert's activeAt, plus the rule's for and one poll interval, is not earlier than the moment the window was both declared and started. It judges the alerts it found firing by the windows that were open when it first read the alert state. If that window has closed by the first successful read of the windows and the alert still fires, alert.fired goes out then, with the original firedAt, and its alert.resolved follows normally. When the windows cannot be read, new alerts are delivered without suppression while edges already held stay held until a read succeeds; the failure is logged and counted in kconmon_ng_console_webhook_maintenance_read_errors_total. After a restart inside a window with the windows unreadable, the alert.resolved of an alert that was already firing when the restarted console first read the alert state waits for a successful read too. It is then judged by the windows open at that first read: suppressed if the previous process held the alert, delivered otherwise. Maintenance windows only govern this console's webhooks: alerts the chart's PrometheusRule routes through Alertmanager are silenced there. The full delivery contract (signatures, retries, replica duplicates, what to deduplicate on) is on Settings.
Getting here
The Overview's Firing alerts panel links each firing alert to its rule here (/alerting?rule=<id>); firing state itself is read there and in an investigation's timeline, while this page manages the rules. For the walkthrough, see Set up alerting. Chart-shipped (non-console) Prometheus rules are documented in Metrics and alerting.