Install in 15 minutes
From helm install to per-pair, per-protocol metrics in Prometheus. Nothing on
this page needs the Console; that is the next page.
Prerequisites
- Kubernetes 1.31+ (CI runs against 1.37).
- Helm 4, or Helm 3 from 3.14 up, the floor every project doc states. The chart ships as an OCI artifact, which both pull natively.
- Prometheus somewhere to scrape the metrics. The Prometheus Operator is
optional: with it you get the bundled
ServiceMonitorand alert rules; a plainscrape_configworks too.
The agent needs no added capabilities. ICMP and MTR ride the unprivileged
ICMP socket that the net.ipv4.ping_group_range sysctl opens; the chart sets
that sysctl (a kubelet safe one) along with RBAC for the controller's node
watch. Every component drops ALL capabilities and passes restricted Pod
Security Standards unchanged.
If your admission policy still objects to the sysctl
The sysctl has its own switch, agent.pingGroupRange: false, precisely so
you can opt out without touching agent.podSecurityContext. The old
opt-out was nulling that whole block, which deleted runAsNonRoot,
runAsUser and seccompProfile with it, exactly the keys a namespace
enforcing restricted PSS demands, so the DaemonSet got rejected at
admission. With the sysctl off, ICMP and MTR need another door: add
NET_RAW under agent.securityContext.capabilities and make it
effective. That buys intermediate MTR hops on kernels that withhold them
from ping sockets, and costs you the restricted PSS profile.
No cluster at hand?
make local-up in a repo clone brings up Minikube with Prometheus, Grafana
and kconmon-ng in one command, and
the demo then breaks the network on purpose so
you can watch the tool catch it.
Install the chart
The chart is published as an OCI artifact on GHCR. With the Prometheus Operator objects, which is what most installs want:
helm upgrade --install kconmon-ng oci://ghcr.io/esdmitrii/charts/kconmon-ng \
  --set serviceMonitor.enabled=true \
  --set prometheusRule.enabled=true
Without the operator, drop both --set flags. The examples track the latest
published chart; pass --version if you need a pinned, reproducible install.
Expect one controller pod plus one agent per node. The agent DaemonSet
tolerates every taint by default (tolerations: [{operator: Exists}]), so
control-plane nodes get one too:
What the fleet costs
Per node, the agent requests 50m CPU and 64Mi memory, with limits at 200m and 128Mi. The controller carries the same defaults, and can afford to: it is coordination only, no probe result ever flows through it. On a 100-node cluster the whole fleet therefore asks for about 5 CPU and 6.25Gi of requests. The real capacity question is on the Prometheus side; see Scaling and cardinality.
Keeping agents off some nodes
Narrow the blanket toleration (replace agent.tolerations) or pin the
DaemonSet with agent.nodeSelector / agent.affinity. One side effect to
know: the controller derives kconmon_ng_controller_expected_agents from the
count of schedulable nodes, each of which it expects to run an agent. Keep
agents off schedulable nodes and registered stays below expected, so the
bundled KconmonAgentsMissing alert fires about a gap you created on
purpose. Cordoned nodes are excluded from the count; selector-excluded ones
are not.
Verify agents are probing
Metrics start flowing within seconds of the agents registering. To look at
them raw, port-forward any agent and read its /metrics:
AGENT=$(kubectl get pods -l app.kubernetes.io/component=agent -o jsonpath='{.items[0].metadata.name}')
kubectl port-forward "$AGENT" 8080 &
curl -s http://localhost:8080/metrics | grep '^kconmon_ng_udp_packet_loss_ratio' | head
You should see per-pair series naming real node pairs:
kconmon_ng_udp_packet_loss_ratio{source_node="…",destination_node="…"}.
The grep is that narrow on purpose: the agent's own kconmon_ng_agent_*
families sort first, so grep '^kconmon_ng' | head shows only those. If the
list is empty, check that more than one agent is running: a
one-node cluster has no peers to probe.
Why port 8080 here when the scrape target is 9091? Both listeners serve
GET /metrics. Port 8080 is the agent's HTTP port and the handy one for a
quick port-forward; config.metricsPort (9091) is a dedicated listener that
exists because the controller's API shares the HTTP port and authenticates
nothing, so the scrape NetworkPolicy opens only 9091. The
FAQ entry has the
full reasoning.
Look at the metrics
Ask your Prometheus the three questions that matter on day one:
# Is any pair losing UDP packets? (all pairs should read 0)
kconmon_ng_udp_packet_loss_ratio

# Is any TCP probe failing anywhere?
sum(rate(kconmon_ng_tcp_results_total{result="fail"}[5m]))

# Is the fleet complete? (both numbers should match)
kconmon_ng_controller_registered_agents
kconmon_ng_controller_expected_agents
The first query returns one series per ordered pair, so N nodes give N×(N−1) rows; on the stand these screenshots come from, ten in-cluster agents plus one external agent, that is 110:
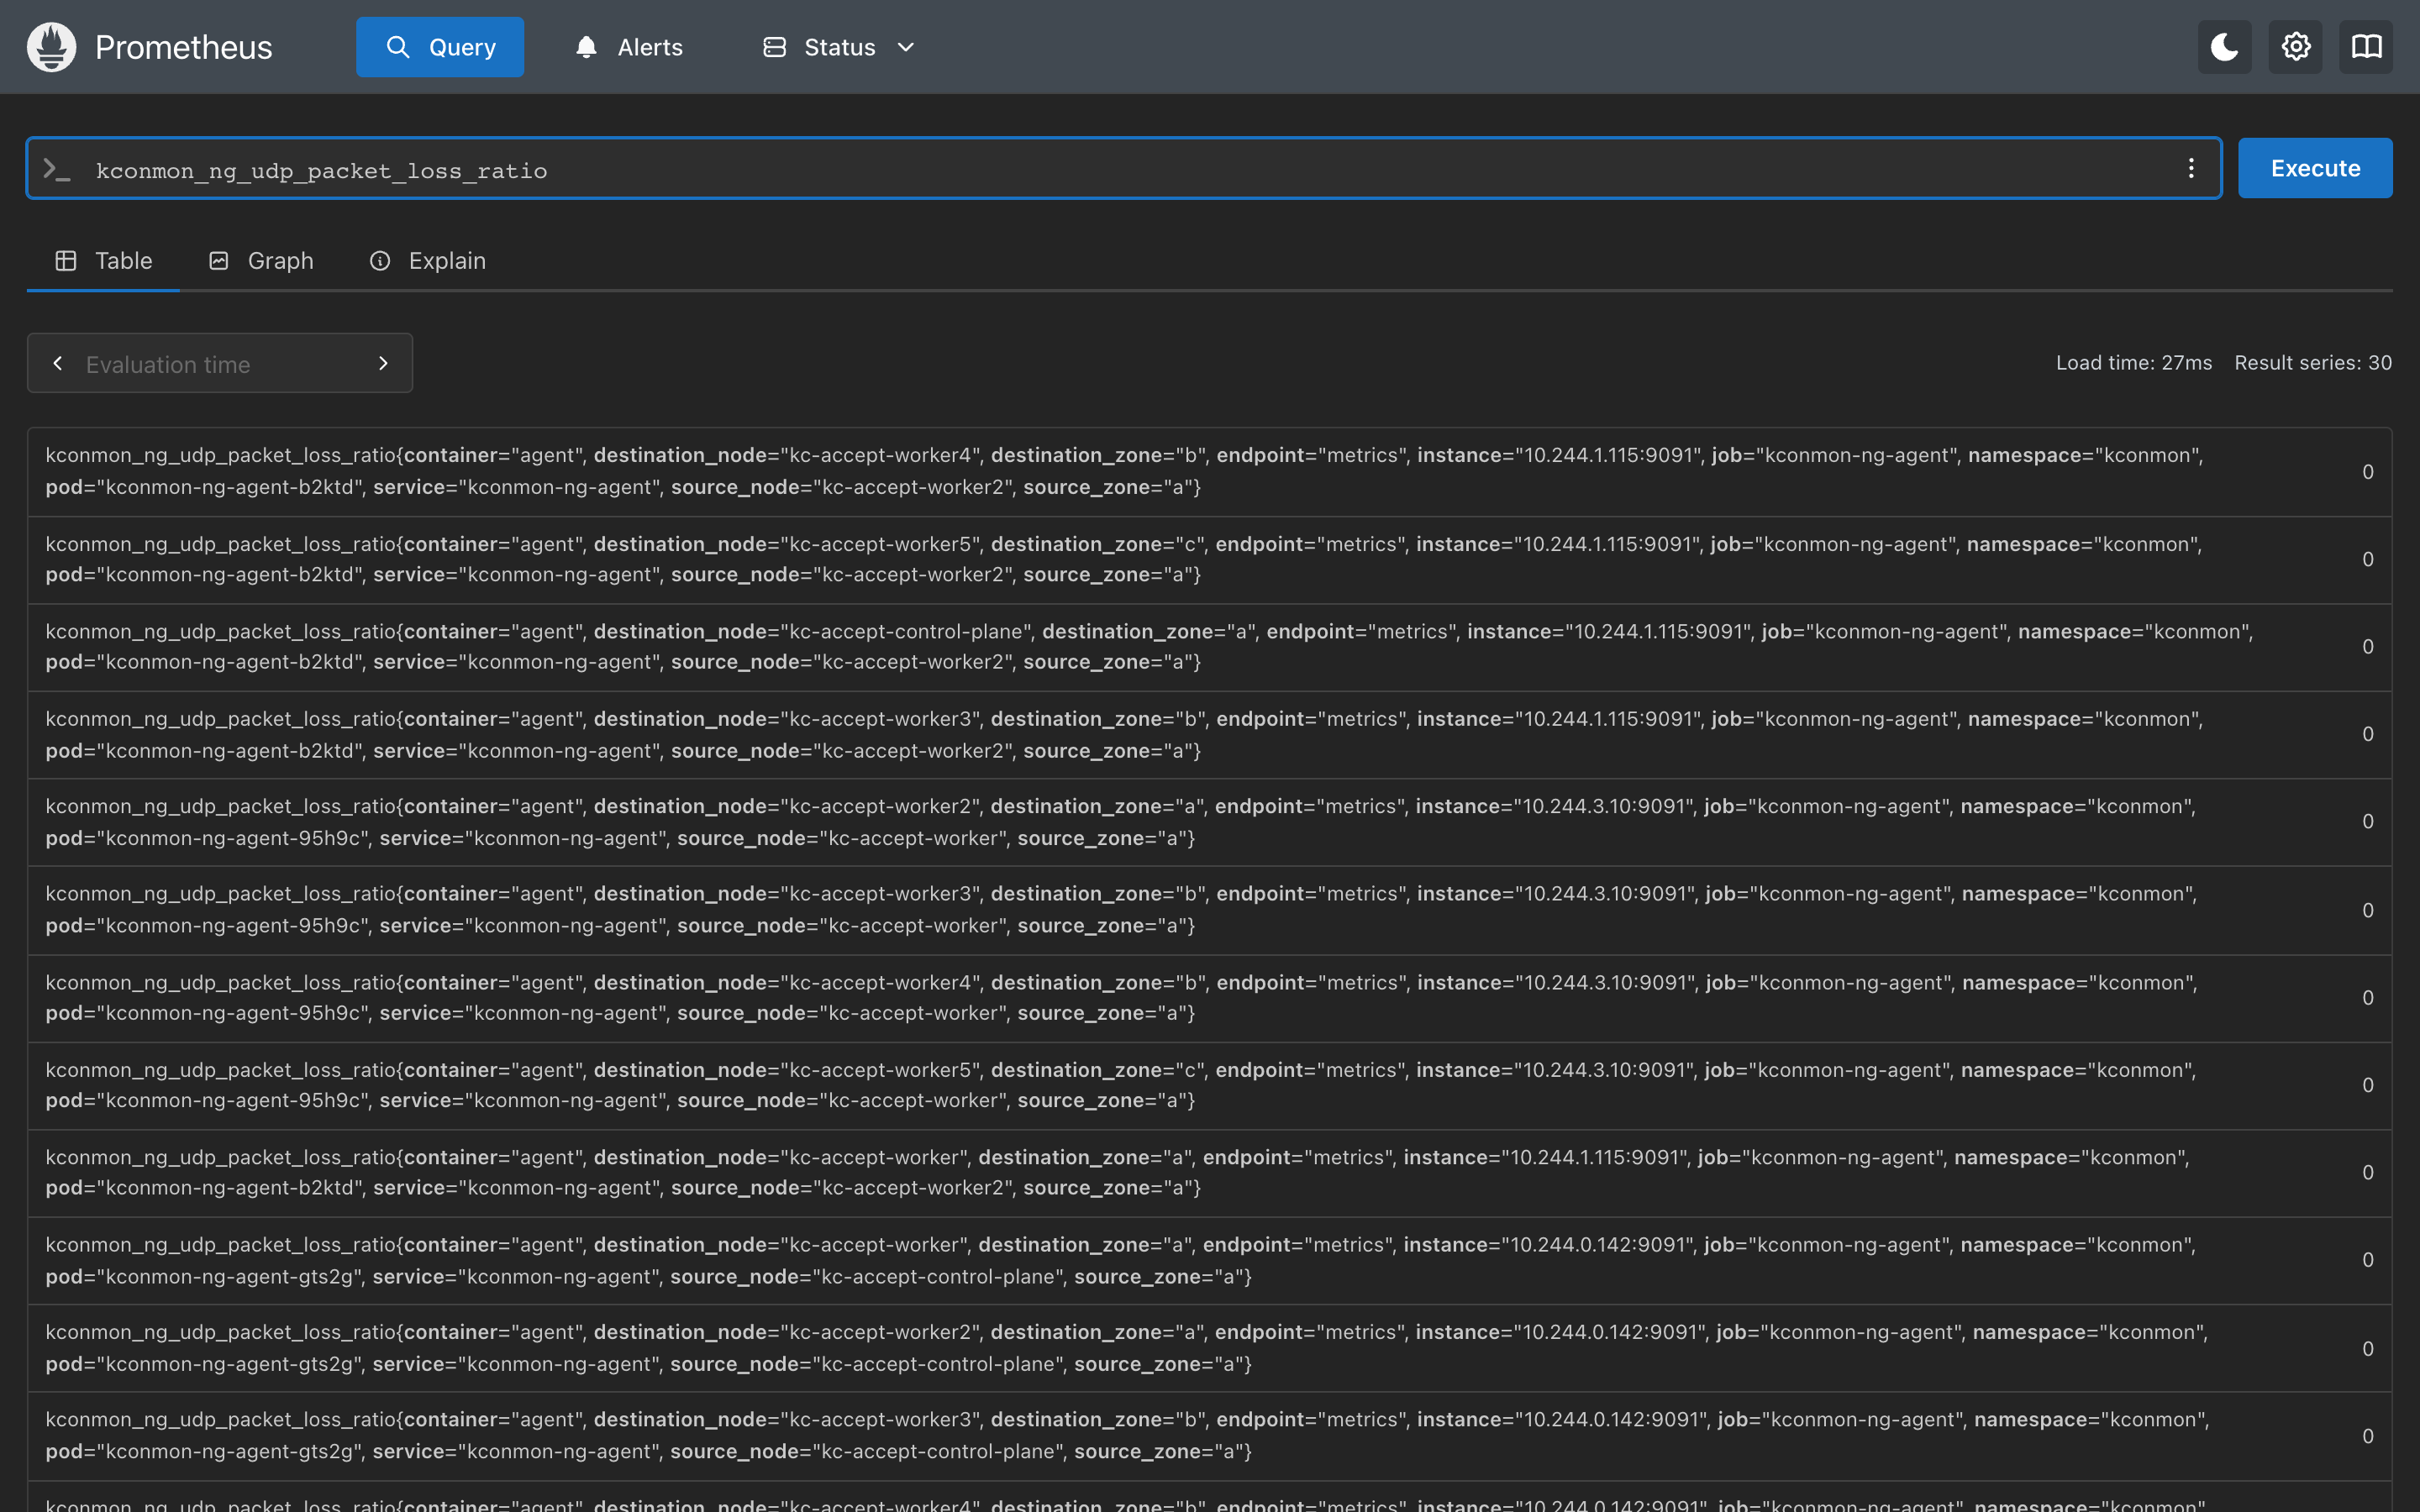
kconmon_ng_udp_packet_loss_ratio returns 30 series, every one at 0, each with source/destination node and zone labels.Every exported family, its labels and the fourteen bundled alert rules (thirteen on by default) are in the metrics and alerting reference.
Grafana dashboards
Three dashboards ship with the project: cluster overview, zone heatmap, per-node detail. If your Grafana runs the dashboard sidecar, let the chart install them as ConfigMaps:
helm upgrade kconmon-ng oci://ghcr.io/esdmitrii/charts/kconmon-ng \
  --reset-then-reuse-values --set dashboards.enabled=true
--reset-then-reuse-values (Helm 3.14+) keeps the values you set earlier and
takes every default from the new chart; plain --reuse-values would drop
defaults the chart added since your install. If you keep your values in a
file, pass -f <your-values.yaml> --set dashboards.enabled=true instead.
Otherwise import the JSON files from the repo's
dashboards/
directory through the Grafana UI.
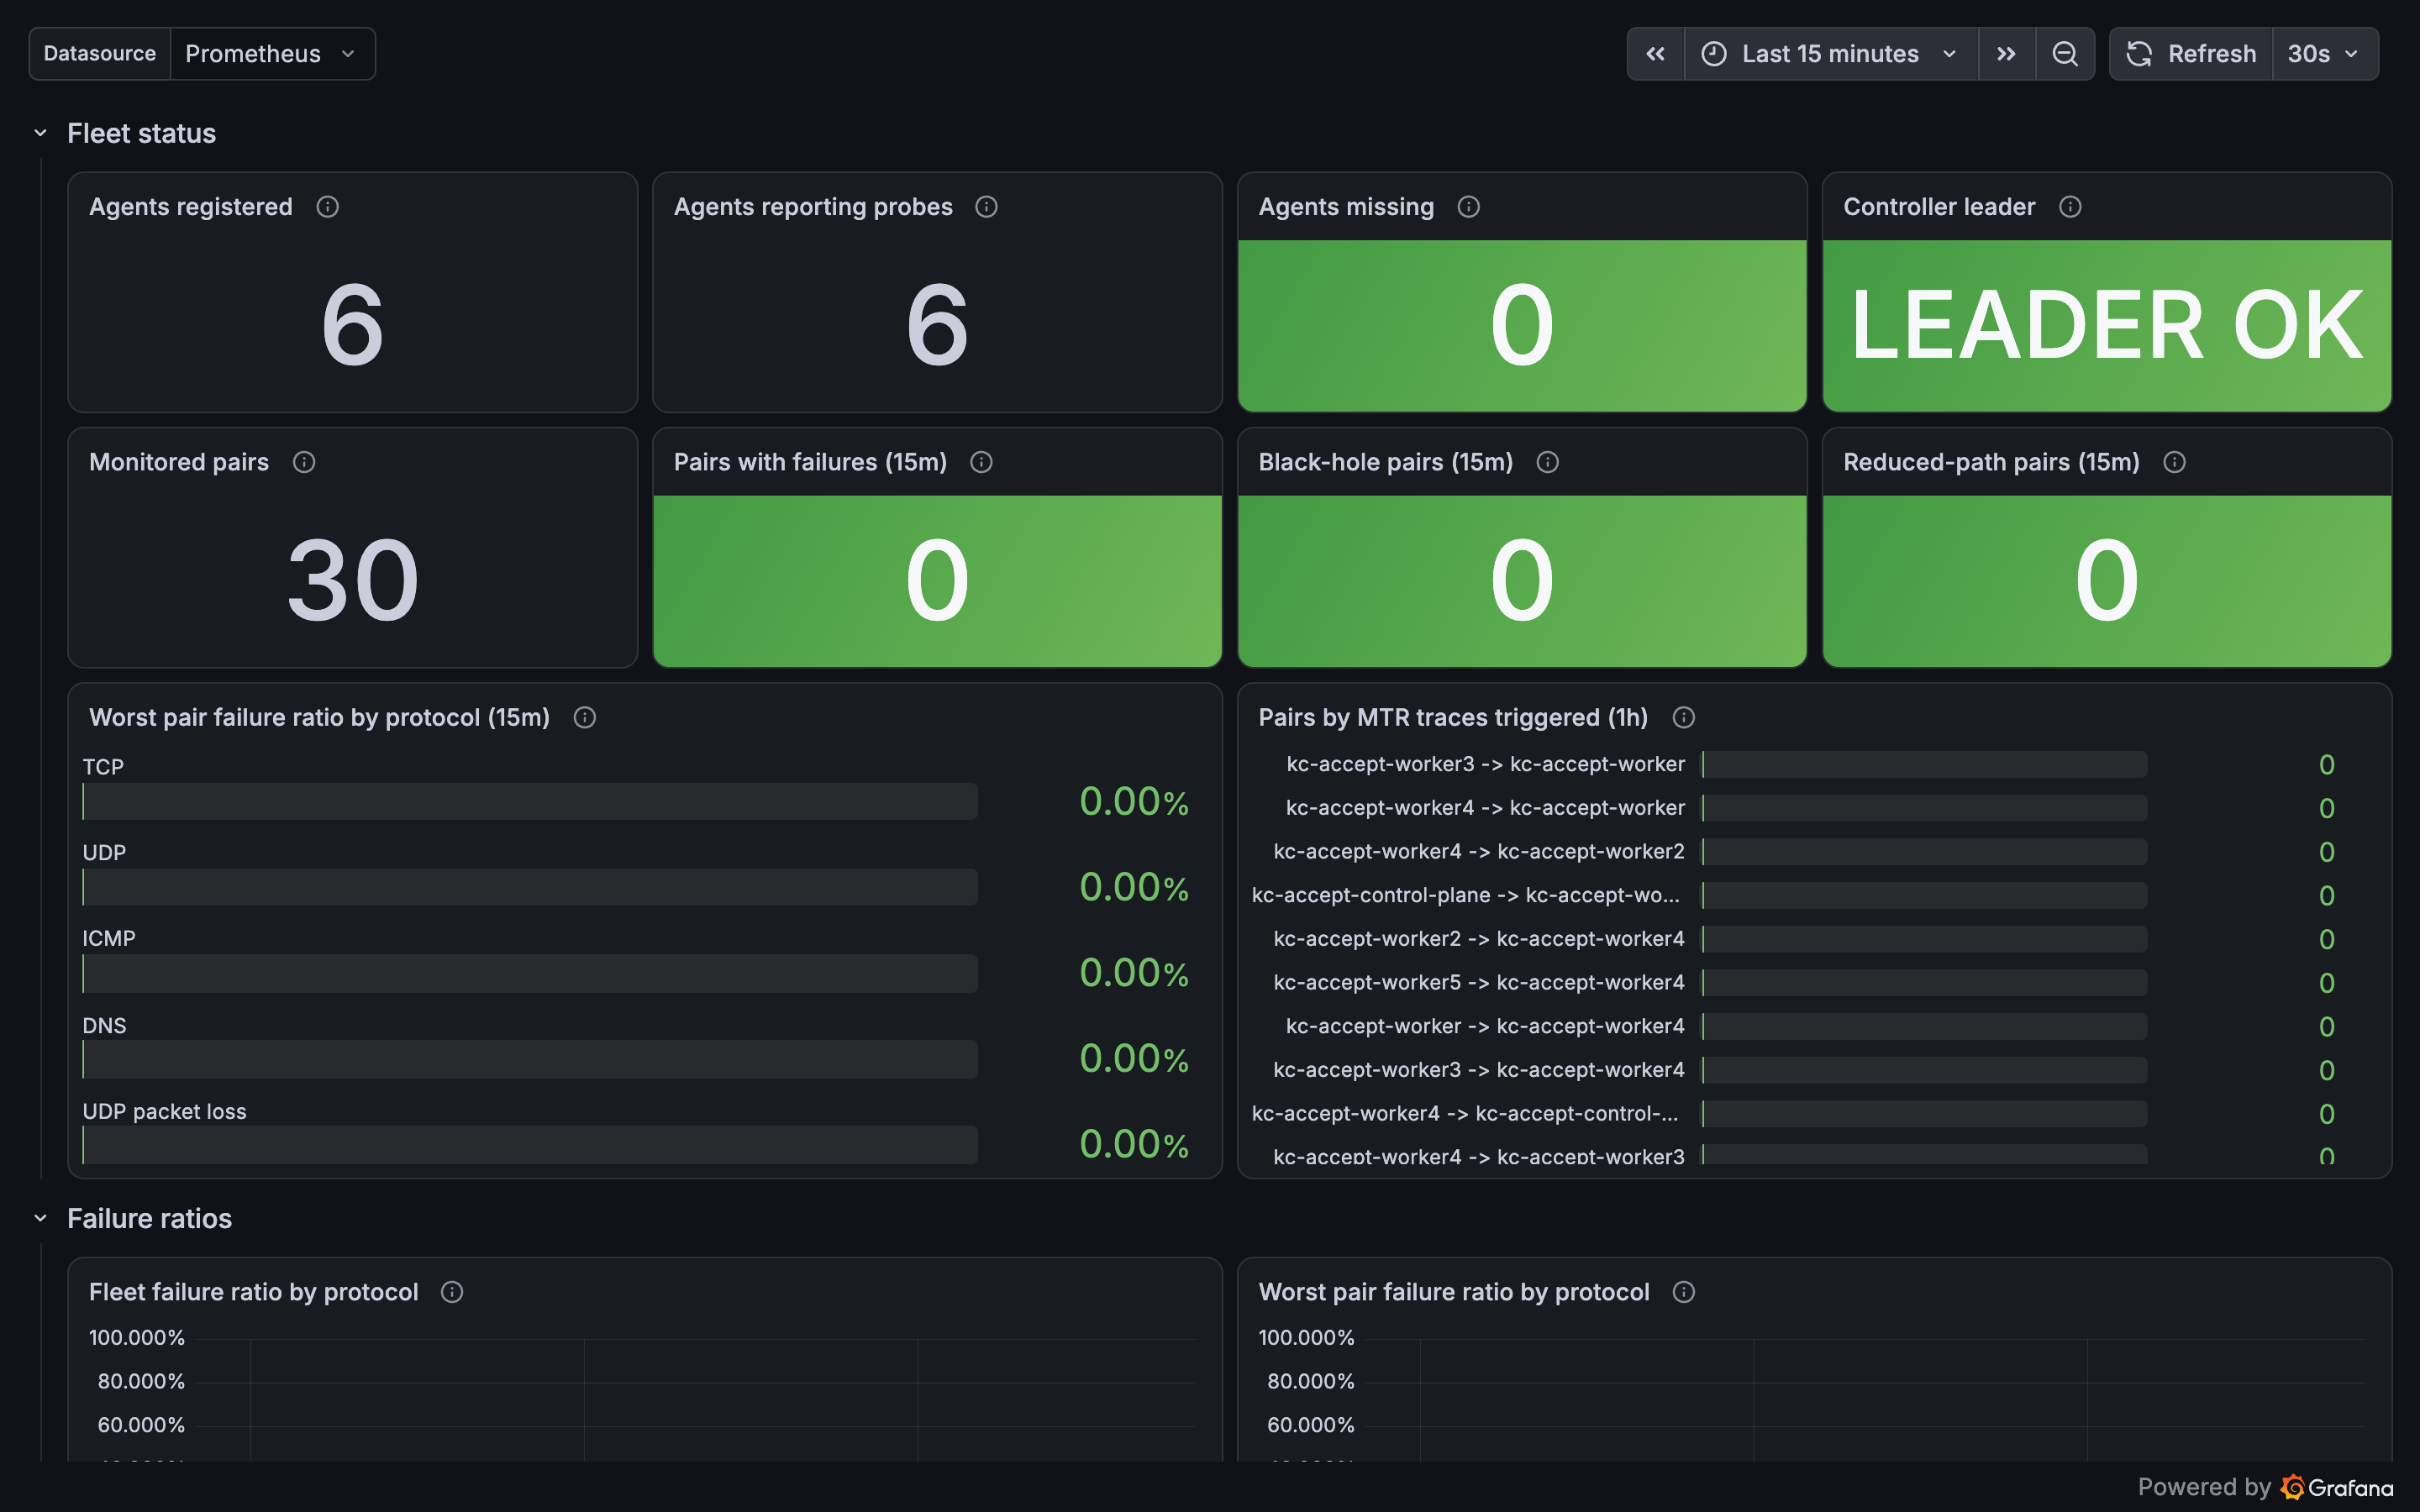
The cluster-overview dashboard below was captured on the same stand while it was healthy, so this is the baseline a clean fleet gives you:
No Prometheus Operator?
Skip serviceMonitor.enabled and add one scrape job instead. The agent and
the controller both expose a dedicated metrics port (config.metricsPort,
9091 by default) on their Services, kept separate from the unauthenticated
API port, so a single endpoints-role job covers the whole fleet:
scrape_configs:
  - job_name: kconmon-ng
    kubernetes_sd_configs:
      - role: endpoints
        namespaces:
          names: [default] # the namespace kconmon-ng is installed into
    relabel_configs:
      - source_labels: [__meta_kubernetes_service_label_app_kubernetes_io_name]
        regex: kconmon-ng
        action: keep
      - source_labels: [__meta_kubernetes_endpoint_port_name]
        regex: metrics
        action: keep
      - source_labels: [__meta_kubernetes_pod_node_name]
        target_label: node
The bundled alert rules are plain PromQL: if PrometheusRule is not an option
either, lift them from the
default alerting rules into your own
rule_files.
Next steps
The natural next move is enabling the console: the web UI is a flag on the release you just installed. After that, catch a breakage breaks a node pair on a test cluster and lets you watch the tool isolate it. When you start tuning, the Helm values reference documents every knob inline, and Scaling and cardinality is required reading before a large-cluster rollout: pairs grow as N×(N−1).