Enable the console
The Console is an optional web UI deployed by the same chart, off by default. It reads the same Prometheus and the same controller you already run: no second data path, no agent changes.
What the console adds
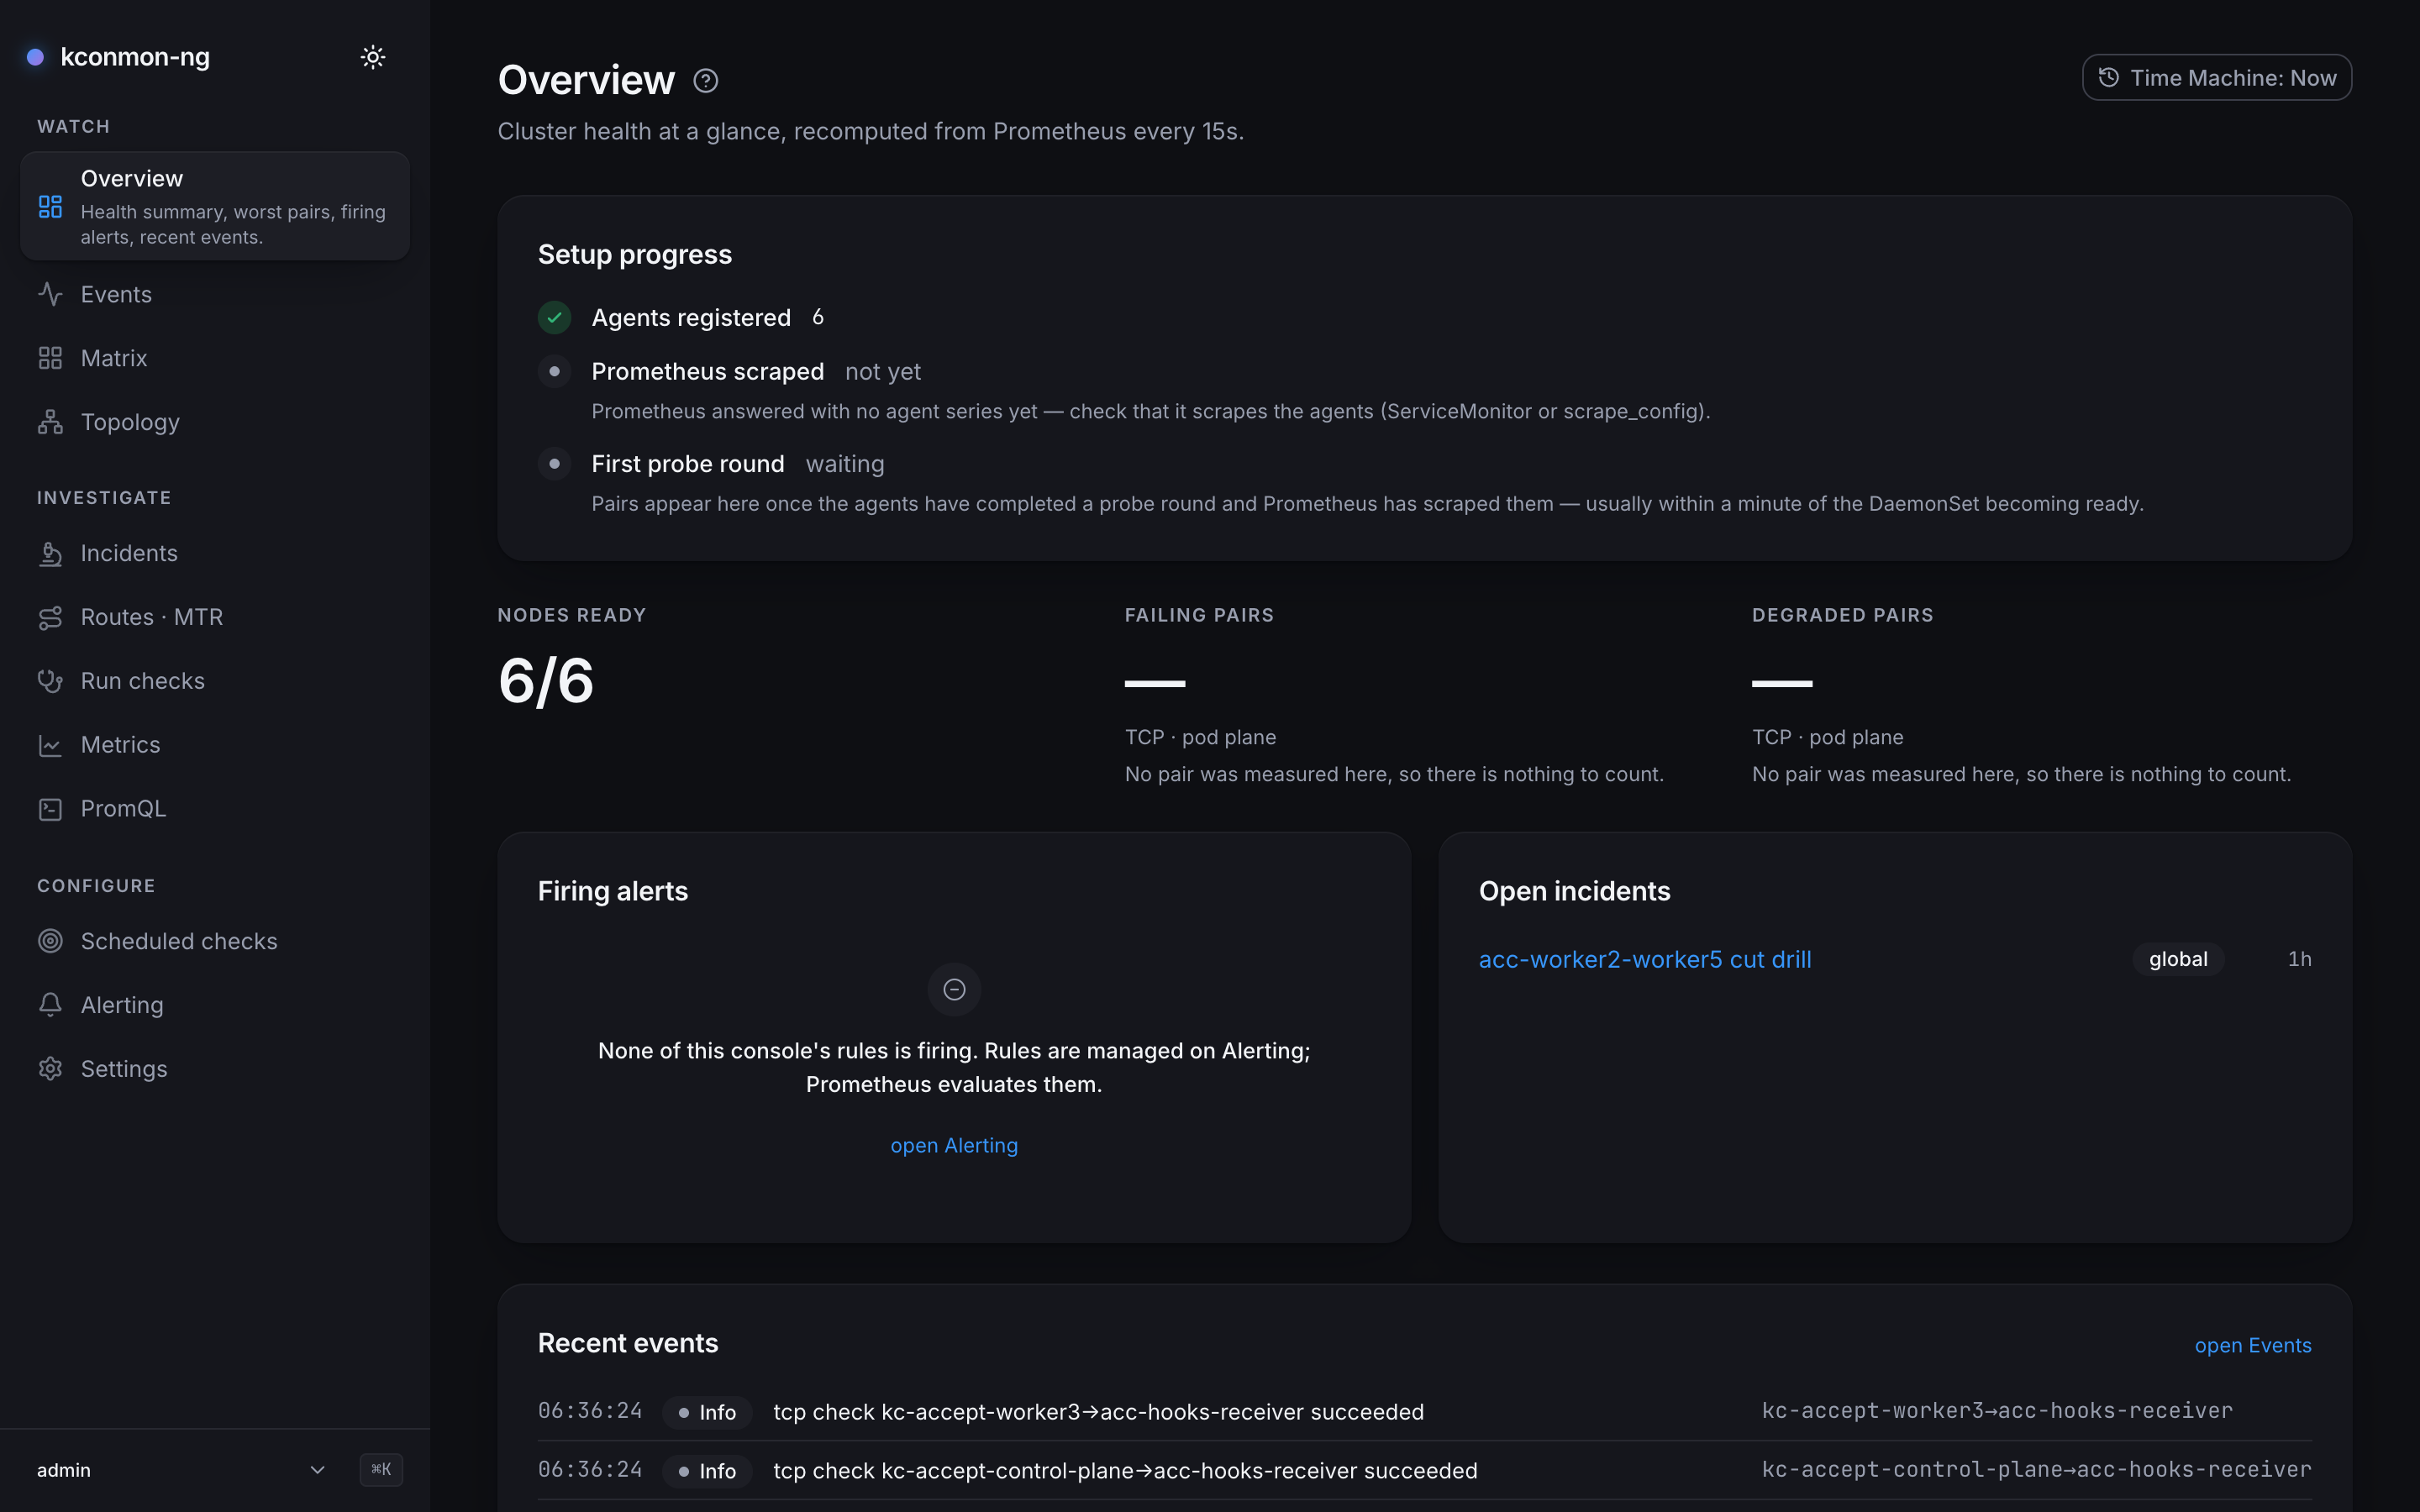
With nothing but a Prometheus URL you get the Matrix
as an N×N heatmap, a topology map, an
Overview health summary, curated
metric charts and a raw
PromQL page. Turn on more flags and it grows durable
history, incident timelines,
MTR path history, an
alert-rule editor, authentication with RBAC and an
audit log, and the Time Machine: a ?at= on any
URL rewinds every page to a past instant. The
console guide walks every screen.
One flag per capability
Each capability is a single flag, and a missing one disables exactly its own features while everything else keeps working.
| Flag | What it unlocks | While it is off |
|---|---|---|
console.prometheus.url |
The data pages: Matrix, Metrics, PromQL | Those API routes answer 503; topology still works |
database.existingSecret |
History, incidents, saved alert rules, audit log, local/oidc auth, schedules |
In-memory console: read-only pages only, nothing survives a restart |
redis.existingSecret |
Sessions, rate-limit counters and realtime fan-out shared across replicas | In-process bus; console.replicas must stay 1 (the chart refuses more) |
controller.events.enabled |
Realtime push: the Events feed and matrix updates over a WebSocket | Pages poll every 15s and say so |
console.alerting.enabled |
The alert-rule editor, reconciled into one console-owned PrometheusRule |
The Alerting page cannot sync rules; needs a database and the Prometheus Operator CRD |
What "read-only pages" means concretely: without a database, everything fed
by Prometheus and the controller stays up: Overview, Matrix, Topology,
Metrics, PromQL, and the live Events feed (its scrollback history is a
database feature). A database-backed page is not an error screen while the
flag is off. It renders a teaching empty state that names the capability and
the value that turns it on, and the API routes behind it answer 503.
The replicas restriction has a concrete reason. Sessions, the fixed-window rate-limit counters and the realtime fan-out all live in the Redis-compatible bus; without one they are in-process, so a second replica would silently double every rate limit and lose cross-replica realtime updates. The chart refuses the combination at render time instead of letting that happen.
Two of the flags are not console.* keys on purpose: PostgreSQL and the
Redis-compatible bus are infrastructure the chart consumes, never installs.
Each is a Secret holding one DSN (postgres://…, redis://…); any provider
works. The chart README
documents the stack it is tested against (CloudNativePG, valkey-helm).
Minimal enable
Two keys on the release from the install page, nothing else changes:
helm upgrade kconmon-ng oci://ghcr.io/esdmitrii/charts/kconmon-ng \
  --reset-then-reuse-values \
  --set console.enabled=true \
  --set console.prometheus.url=http://prometheus-operated.monitoring:9090

kubectl port-forward svc/kconmon-ng-console 8081:8080
--reset-then-reuse-values keeps what you set on the install page
(serviceMonitor, prometheusRule, dashboards). Without it Helm resets
every earlier --set to the chart default: the ServiceMonitor,
PrometheusRule and dashboards disappear, Prometheus stops scraping the agents
and the Matrix comes back empty. If you keep your values in a file, pass
-f <your-values.yaml> together with the two --set flags instead.
That gets you the read-only pages as an anonymous viewer on http://localhost:8081.
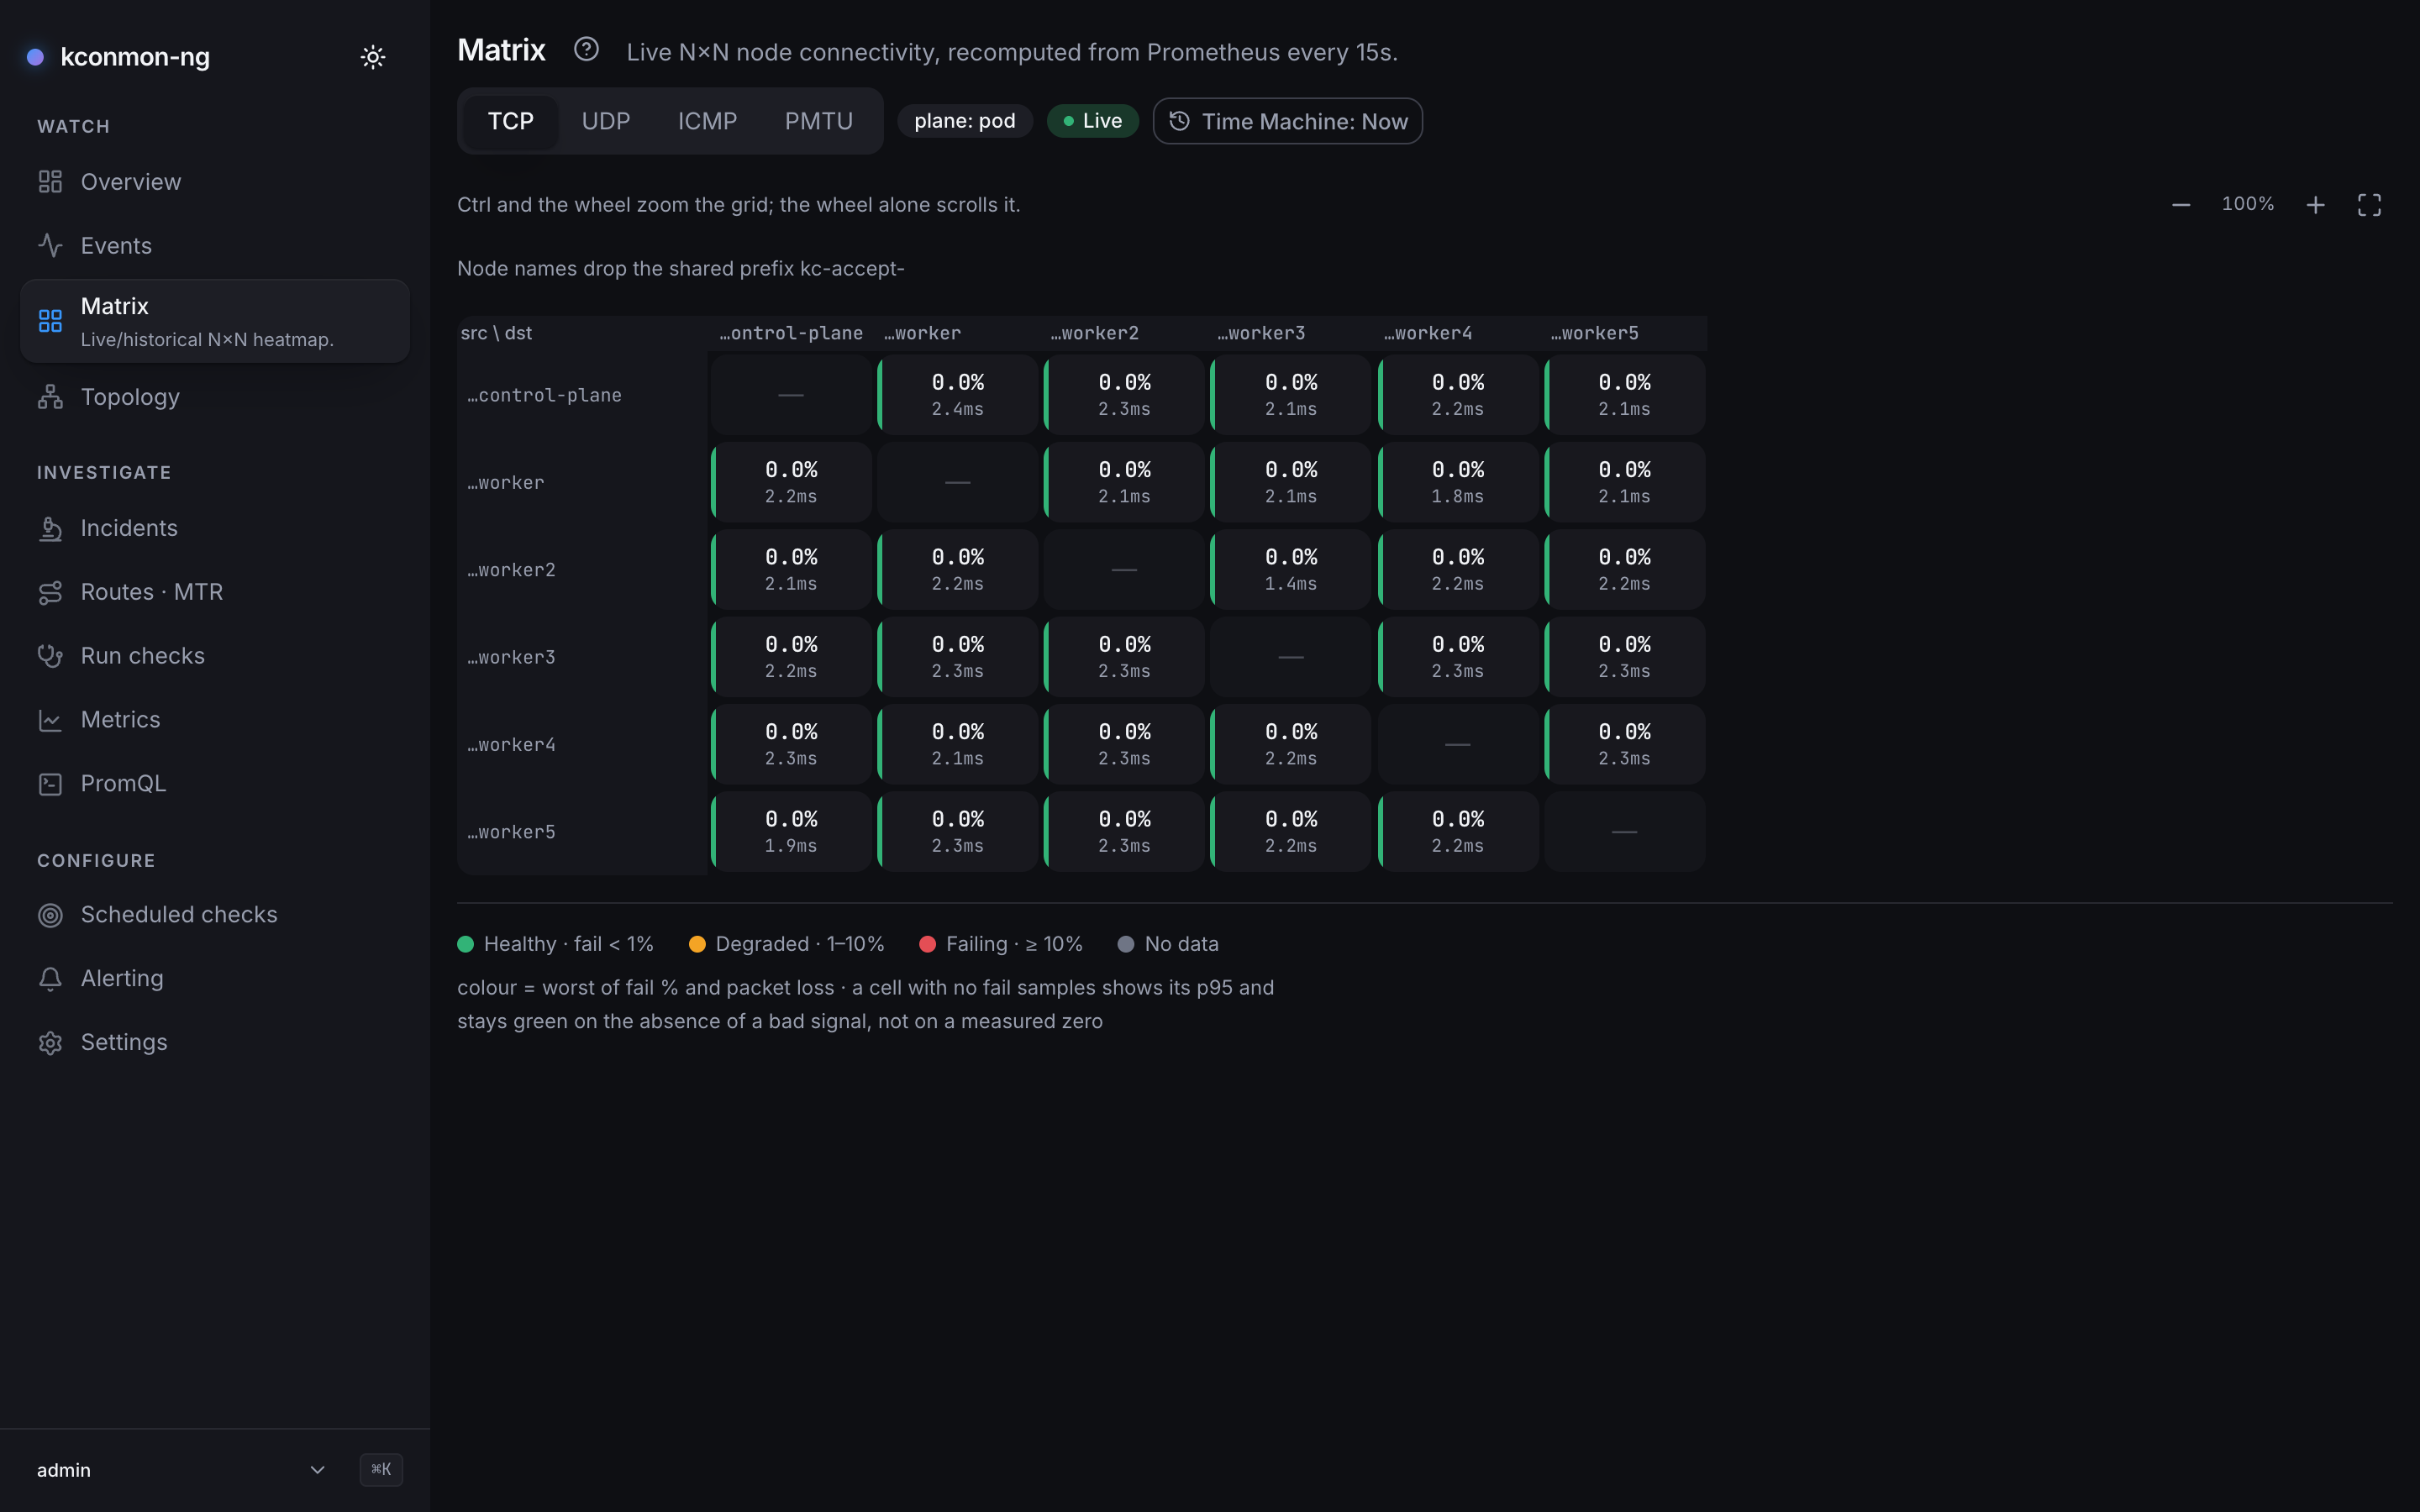
controller.events.enabled on; with the Prometheus URL alone the page polls instead.Add flags from the table above one at a time as you need them; every knob is documented inline in the full values.yaml.
Authentication modes
console.auth.mode picks one of four modes; RBAC applies in all of them
(the built-in roles are viewer, operator, alert-editor and admin,
and custom roles can be added).
| Mode | Identity comes from | Requires |
|---|---|---|
anonymous (default) |
nobody: every request gets the fixed console.auth.anonymous.role (viewer by default) |
nothing |
local |
username/password against the database, with a bootstrap admin created on first start | database.existingSecret |
header |
a trusted in-cluster reverse proxy setting X-Remote-User/X-Remote-Groups |
non-empty console.auth.header.trustedProxyCIDRs; otherwise headers are an auth bypass, and the console refuses to start |
oidc |
your identity provider, authorization-code flow with PKCE | database.existingSecret; plus redis.existingSecret when console.replicas > 1 |
For header and oidc, map the groups your identity provider asserts onto
console roles with console.auth.groupRoles: that map is what makes a fresh
install usable before anyone can create role bindings through the API. The
OIDC setup scenario walks the full flow.
Behind an Ingress, set console.clientAddress.trustedProxyCIDRs to the
ingress controller's addresses (its pod CIDR at the widest) in every mode; a
pod inside the list can name any client address. The console takes the client
address for its per-address rate limits, the /ws socket cap and the audit
log from X-Forwarded-For only when the connection comes from one of those
networks; without them every client shares the ingress's address and one
budget. That list never grants identity. In header mode,
console.auth.header.trustedProxyCIDRs names only the authenticating proxy
(see below); while
the client-address list is empty, the header list gives the client address
too. With console.ingress.enabled on and both lists empty, the notes
helm install prints name console.clientAddress.trustedProxyCIDRs under
STILL TO DECIDE. See Configuration.
First login in local mode
The bootstrap admin is fully declarative. console.auth.local.bootstrapAdmin
names the account, and its password comes from a Secret you point at with
console.auth.local.existingSecret (key console-local-admin-password by
default; a chart-managed Secret is the alternative). The account is created
on first start only, gated on the users table being empty. A console booting
against a database that already holds any user creates nothing.
The login form posts {"username": ..., "password": ...} to
POST /api/v1/auth/login. A successful sign-in answers 204 No Content
with no body and sets two cookies: the session cookie
(console.auth.session.cookieName, __Host-kconmon_session by default) and
csrf, whose value every later
mutating request echoes in X-CSRF-Token. A script that signs in this way
checks for 204, not for a JSON body. An API token is the simpler route for
automation, but a token holds exactly console.auth.defaultRole and nothing
else: that is empty by default, so a token gets 403 on every permissioned
route until you set it (see Settings).
The user and its admin role binding are written in one transaction, and that detail is operational, not academic. An earlier design re-created a missing binding on every boot, which meant demoting the bootstrap account by hand survived only until the next pod restart. With the transactional create there is no repair loop: demote or delete the account and the change sticks across restarts.
Why header mode ships no default for trustedProxyCIDRs
Trust is decided on RemoteAddr alone, the TCP peer that actually dialed the
console; X-Forwarded-For never enters the decision. Any pod in the cluster
can send an X-Remote-User header, so a default CIDR wide enough to cover
your proxy would also cover pods that are not your proxy: a ready-made auth
bypass. You must name the exact source range your proxy connects from. Behind
ingress-nginx or an Istio gateway that is the address range of those proxy
pods (mind hostNetwork ingress controllers, whose connections arrive from
node addresses instead).
What changes when you flip a flag
Console values (everything under console.*, plus the database/redis Secret
names) land in the console's own ConfigMap and chart-managed Secrets, and
the console Deployment carries checksum annotations over both, so editing
them rolls the console pods and only the console pods. Shared config.*
values roll the agent DaemonSet and the controller instead. The one blind
spot is referenced Secrets: the chart checksums what it renders, not the
content of a Secret you merely name, so rotating a DSN or password in place
rolls nothing; follow it with a
kubectl rollout restart deployment of the console.
Turning database.existingSecret off does not destroy anything. The chart
never installs the PostgreSQL server, so your history, saved rules and audit
rows stay in your database; the console just stops reading them (and
local/oidc logins stop working) until the flag returns. Sessions are the
short-lived exception: they live in Redis or in-process, and a config-driven
restart ends the in-process ones.
Next steps
Ready to see the Console earn its keep? Catch a breakage stages a failure and watches the Matrix isolate it. For a screen-by-screen tour there is the console guide, and set up alerting covers chart-shipped rules, console-managed rules and webhooks.