Breaking the network on purpose: a reproducible kconmon-ng demo
Short on time?
This is the long, verified walkthrough on a disposable kind stand. For the ten-minute version of the same idea on a cluster you already have (one broken pair, caught and explained), take Catch a breakage instead and come back here for the full tour.
This walkthrough deliberately breaks connectivity between two Kubernetes nodes and shows how kconmon-ng pinpoints which protocol, which node pair, and which hop is affected, while every other path stays green. It is the hands-on version of the question kconmon-ng exists to answer: not "is the mesh up?" but "what exactly degraded, and where?"
Every number below came off one kind stand, kconmon-stand, running the 2.4.0
chart: ten in-cluster agents across four zones plus the external agent
edge-host-01, so 110 directed pairs. The commands are the ones that stand ran,
with its node names and pod IPs left in. Your digits will differ. The shape
will not.
Prerequisites
The stand is not a repo helper, so here is its shape. One control plane and ten workers, with the NodePorts mapped to your loopback so nothing depends on a port-forward staying alive:
# kind-config.yaml
kind: Cluster
apiVersion: kind.x-k8s.io/v1alpha4
name: kconmon-stand
nodes:
  - role: control-plane
    extraPortMappings:
      - {containerPort: 30080, hostPort: 30080, listenAddress: 127.0.0.1}  # Console
      - {containerPort: 30090, hostPort: 30090, listenAddress: 127.0.0.1}  # Prometheus
      - {containerPort: 30443, hostPort: 30443, listenAddress: 127.0.0.1}  # external gateway
  - role: worker
  - role: worker
  - role: worker
  - role: worker
  - role: worker
  - role: worker
  - role: worker
  - role: worker
  - role: worker
  - role: worker
Label the zones before installing, so the agents come up knowing them.
worker10 gets no zone and no agent: it plays the bare host that
edge-host-01 runs on.
kind create cluster --config kind-config.yaml
kubectl label node kconmon-stand-control-plane kconmon-stand-worker kconmon-stand-worker2 topology.kubernetes.io/zone=zone-a
kubectl label node kconmon-stand-worker3 kconmon-stand-worker4 kconmon-stand-worker5 topology.kubernetes.io/zone=zone-b
kubectl label node kconmon-stand-worker6 kconmon-stand-worker7 topology.kubernetes.io/zone=zone-c
kubectl label node kconmon-stand-worker8 kconmon-stand-worker9 topology.kubernetes.io/zone=zone-d
kubectl cordon kconmon-stand-worker10
Then install the chart into kconmon-ng with every checker on (TCP, UDP,
ICMP, DNS, HTTP, MTR, external checks), controller.leaderElection: true (the
zone resolver only runs on a leader), an agent affinity that keeps the
DaemonSet off worker10, and the external gateway on NodePort 30443.
Install in 15 minutes covers the
chart, and External agents covers the gateway and the
agent on worker10. Prometheus is a plain Deployment on NodePort 30090, with
no Operator and no Alertmanager.
The Console is already up
The stand's values turn the Console on with the rest of the release:
console.enabled: true, auth.mode: anonymous with the admin role, a
PostgreSQL DSN from a Secret, and the webhook encryption key. The chart has no
NodePort knob for the Console, so a separate NodePort Service puts it on 30080.
Nothing to port-forward:
Keep every value in one file and pass the whole file on every
helm upgrade. Do NOT reach for --reuse-values with a --set on top: it
drops chart defaults added since the first install, and it forgets --set
flags from revisions that failed, so the release you think you have and the
release you get drift apart one upgrade at a time.
Four properties of this stand's values matter later in the walkthrough, so here they are before anything breaks:
database.existingSecretneeds a Secret holding apostgres://DSN and nothing else: the chart stopped installing PostgreSQL in 2.0.0, so any reachable server does, from RDS to a StatefulSet to a CloudNativePG cluster you run yourself. This stand uses a single Postgres Deployment in the same namespace. Without a database the Console still serves Topology, Matrix and Metrics, but incidents, saved alert rules and the audit log all answer503, and the alerting reconciler is skipped rather than running against nothing.console.alerting.enabled=trueneeds thePrometheusRuleCRD. The stand installs the CRD without the Operator. The chart also renders a namespacedRoleletting the Console write exactly that one resource, in this namespace.- Your Prometheus must pick up the object the Console writes. An Operator
does that by selector; this stand has none, so after every rule change it
copies each
PrometheusRulein the namespace into Prometheus' rule files and reloads. On a scoped kube-prometheus-stack the rules can showsyncedand never fire; the caveat is explained in Set up alerting. - This stand runs no Alertmanager. That is fine: the Console's webhooks are dispatched by the Console itself off Prometheus' alert state, not by Alertmanager.
Anonymous-admin means the alert-rule step below needs no permission
change. That is a demo shortcut on a disposable cluster, not a deployment
pattern: the chart's own default is anonymous-viewer, and a real deployment
uses local, header or oidc.
Topology used in this run
| node | zone | agent address |
|---|---|---|
| kconmon-stand-control-plane | zone-a | 10.244.0.2 |
| kconmon-stand-worker | zone-a | 10.244.12.2 |
| kconmon-stand-worker2 | zone-a | 10.244.13.2 |
| kconmon-stand-worker3 | zone-b | 10.244.8.2 |
| kconmon-stand-worker4 | zone-b | 10.244.1.2 |
| kconmon-stand-worker5 | zone-b | 10.244.5.2 |
| kconmon-stand-worker6 | zone-c | 10.244.2.2 |
| kconmon-stand-worker7 | zone-c | 10.244.3.2 |
| kconmon-stand-worker8 | zone-d | 10.244.10.2 |
| kconmon-stand-worker9 | zone-d | 10.244.6.3 |
| kconmon-stand-worker10 | none | no agent (cordoned) |
| edge-host-01 | external | 192.168.97.11 (host network on worker10) |
Agents probe each other pod-IP to pod-IP. Mind the ports when writing
firewall rules: UDP and path MTU probes target the agent's gRPC/probe port 9090, while
TCP probes dial the agent's HTTP port 8080, and Prometheus scrapes 9091.
Blocking the wrong port silently matches zero packets; check the iptables -v
counters.
Baseline: everything green
Before breaking anything, confirm a clean baseline (PromQL against Prometheus on http://localhost:30090):
# per-pair UDP loss: 110 series, none above 0
kconmon_ng_udp_packet_loss_ratio

# per-pair ICMP loss: same
kconmon_ng_icmp_packet_loss_ratio

# no TCP failures
sum(rate(kconmon_ng_tcp_results_total{result="fail"}[5m]))

# MTR has had nothing to chase lately
sum(increase(kconmon_ng_mtr_triggered_total[15m]))
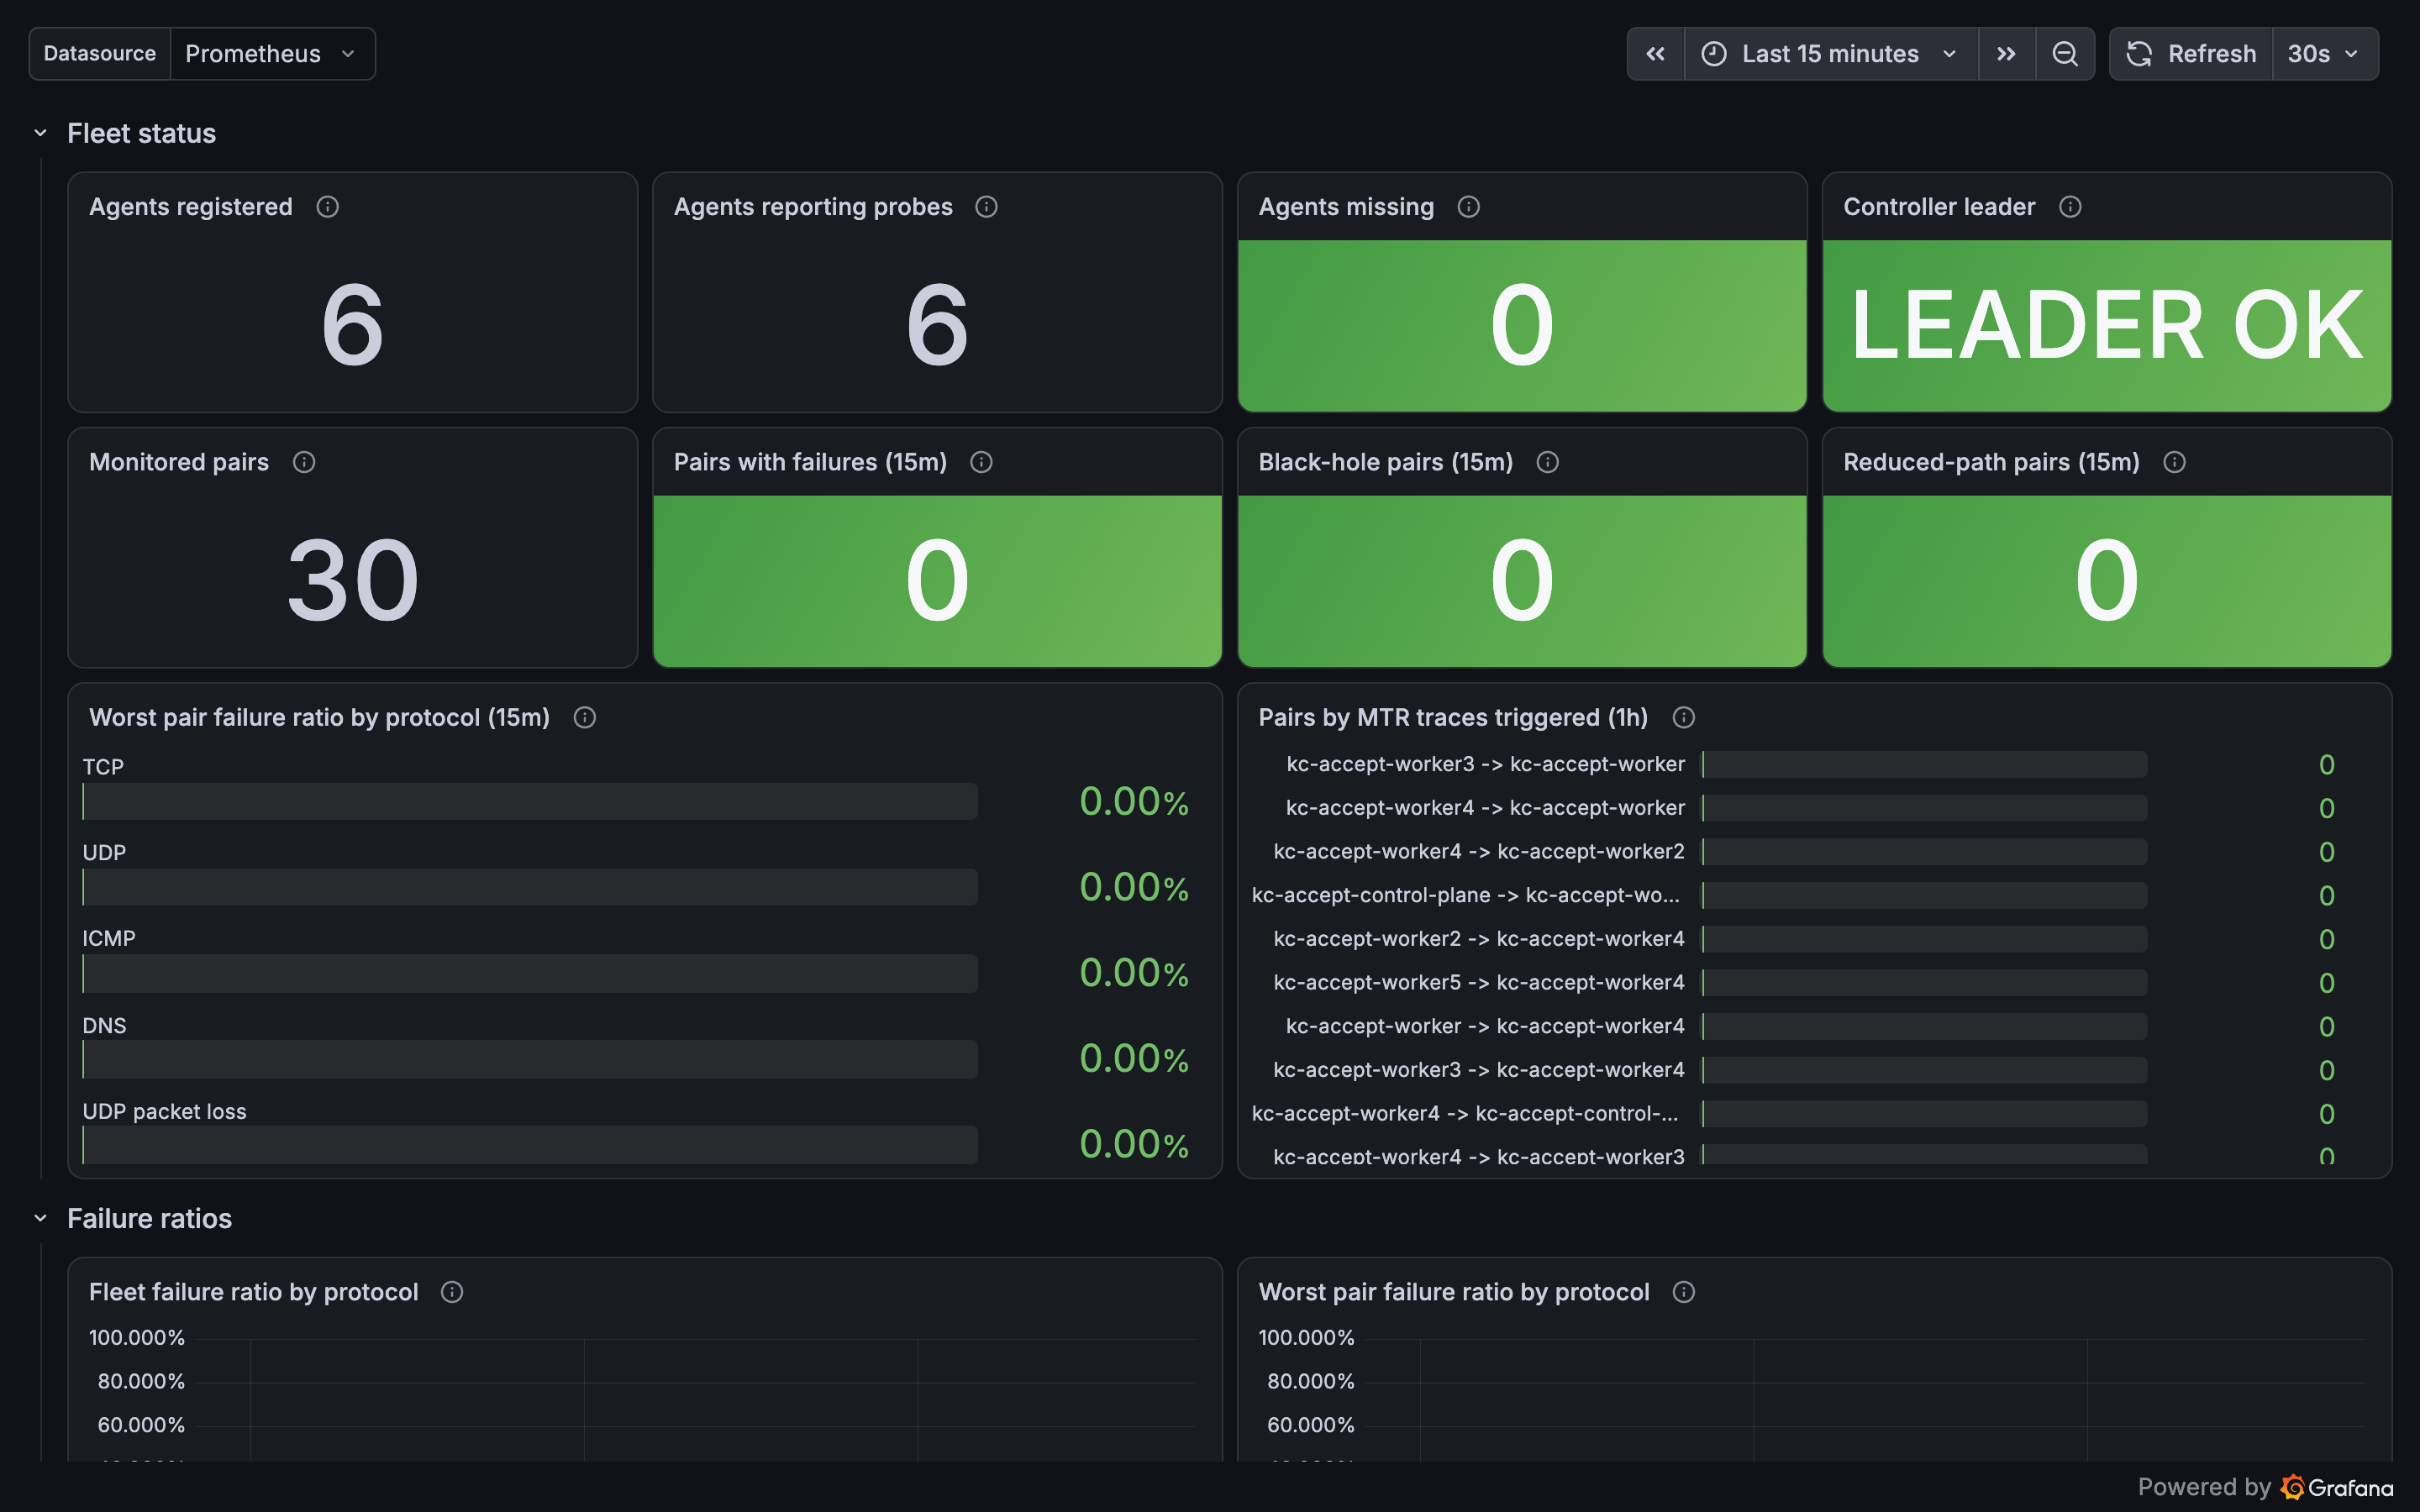
Observed at 11:10 UTC on the stand: 110 UDP and 110 ICMP loss series, none of
them above 0; a TCP fail rate of 0; no MTR trace triggered in the last 15
minutes. controller_registered_agents read 11 against
controller_expected_agents 10, and controller_external_agents 1 explains
the gap: the external agent registers but is never expected. The only firing
alert was ExternalChecksFailing, for a target the stand keeps unreachable on
purpose. The overview dashboard is all green:
Break: blackhole UDP between two nodes
We drop only UDP from worker2 to worker6 (pod to pod, port 9090),
leaving TCP, ICMP and every other pair untouched. The path MTU probe uses the
same echo port, so that pair's PMTU cell goes empty (no verdict) within five
minutes rather than red. That is what a
firewall typo, a conntrack table filling up, or an overlay offload bug actually
looks like in production: one protocol, one direction, one pair, and every
health check in the cluster still green.
A kind node is a container, so docker exec reaches its iptables. Cross-node
pod traffic transits the FORWARD chain on the destination node, so the rule
goes on worker6:
docker exec kconmon-stand-worker6 iptables -I FORWARD 1 -p udp \
  -s 10.244.13.2 -d 10.244.2.2 --dport 9090 \
  -j DROP -m comment --comment kconmon-demo-udp-blackhole
Confirm it is matching packets (the counter climbs):
docker exec kconmon-stand-worker6 iptables -L FORWARD 1 -v -n
# 15 packets / 480 bytes dropped 15s after the insert
Note:
tcpdumpis absent on kind nodes. Use the iptables-vpacket counters orconntrack -Lto confirm the rule is doing what you think.
What kconmon-ng shows (within a minute)
The stand inserted the rule at 12:24:37 UTC, and twelve seconds later the picture was unambiguous:
kconmon_ng_udp_packet_loss_ratio{source_node="kconmon-stand-worker2", destination_node="kconmon-stand-worker6"}= 1 from 12:24:49: total UDP loss on exactly that ordered pair.- The other 109 pairs stay at 0 UDP loss.
count(kconmon_ng_udp_packet_loss_ratio > 0)never went above 1 during the break, and the reverse leg, worker6 → worker2, read 0 throughout. kconmon_ng_icmp_packet_loss_ratiofor worker2 → worker6 = 0, and no ICMP series anywhere rose above 0: ICMP is green.- TCP worker2 → worker6: not one failed probe, with successes still flowing at 0.2/s: TCP is green.
- So for the identical node pair, UDP is dead while TCP and ICMP are healthy: kconmon-ng isolates both the failing path and the failing protocol.
Useful PromQL for the panels:
# the one red pair jumps out
kconmon_ng_udp_packet_loss_ratio > 0

# prove the same pair is fine on other protocols
kconmon_ng_icmp_packet_loss_ratio{source_node="kconmon-stand-worker2",destination_node="kconmon-stand-worker6"}
Reactive MTR fires automatically
A full UDP blackhole means lossRatio = 1.0, so the check fails hard, and a
failed TCP/UDP/ICMP check auto-triggers an MTR trace for that pair (rate-limited
to once per 60s per pair). No operator action:
kconmon_ng_mtr_triggered_total{source_node="kconmon-stand-worker2",destination_node="kconmon-stand-worker6"}
kconmon_ng_mtr_hop_rtt_seconds{source_node="kconmon-stand-worker2",destination_node="kconmon-stand-worker6"}
The counter is cumulative, and on this stand it already read 61 from earlier
breaks. It ticked to 62 by 12:24:49 and reached 67 when the rule came out at
12:30:20: six traces in 5 minutes 43 seconds, one a minute, which is the
cooldown doing its job. kconmon_ng_mtr_hops for the pair reads 3, and the hop
series puts hop 3 on 10.244.2.2, the target agent, at 0.12 ms. The route
itself is intact, which is exactly the hint you want: this is a filter on one
protocol, not a broken path. The failing path was captured the moment it
broke, not after you SSH in to investigate.
The alert
The bundled UDPLossHigh rule (kconmon_ng_udp_packet_loss_ratio > 0.5,
for: 5m, severity warning) went pending at 12:24:50, 13 seconds after the
break (visible at Prometheus /alerts, labelled
source_node=kconmon-stand-worker2, destination_node=kconmon-stand-worker6)
and turned firing at 12:29:50, once the 5-minute hold had passed. The hold
is deliberate: it rides out transient blips and only fires on sustained loss.
The Console's /api/v1/alerts listed it firing too.
Timing summary for this run: loss visible in metrics within 12 seconds of the
insert; alert pending at 13 seconds; firing 5 minutes 13 seconds after the
break.
The same break, through the Console
Everything above is PromQL and Grafana. The same minute looks like this in the Console at http://localhost:30080.
Watch it go red on /matrix
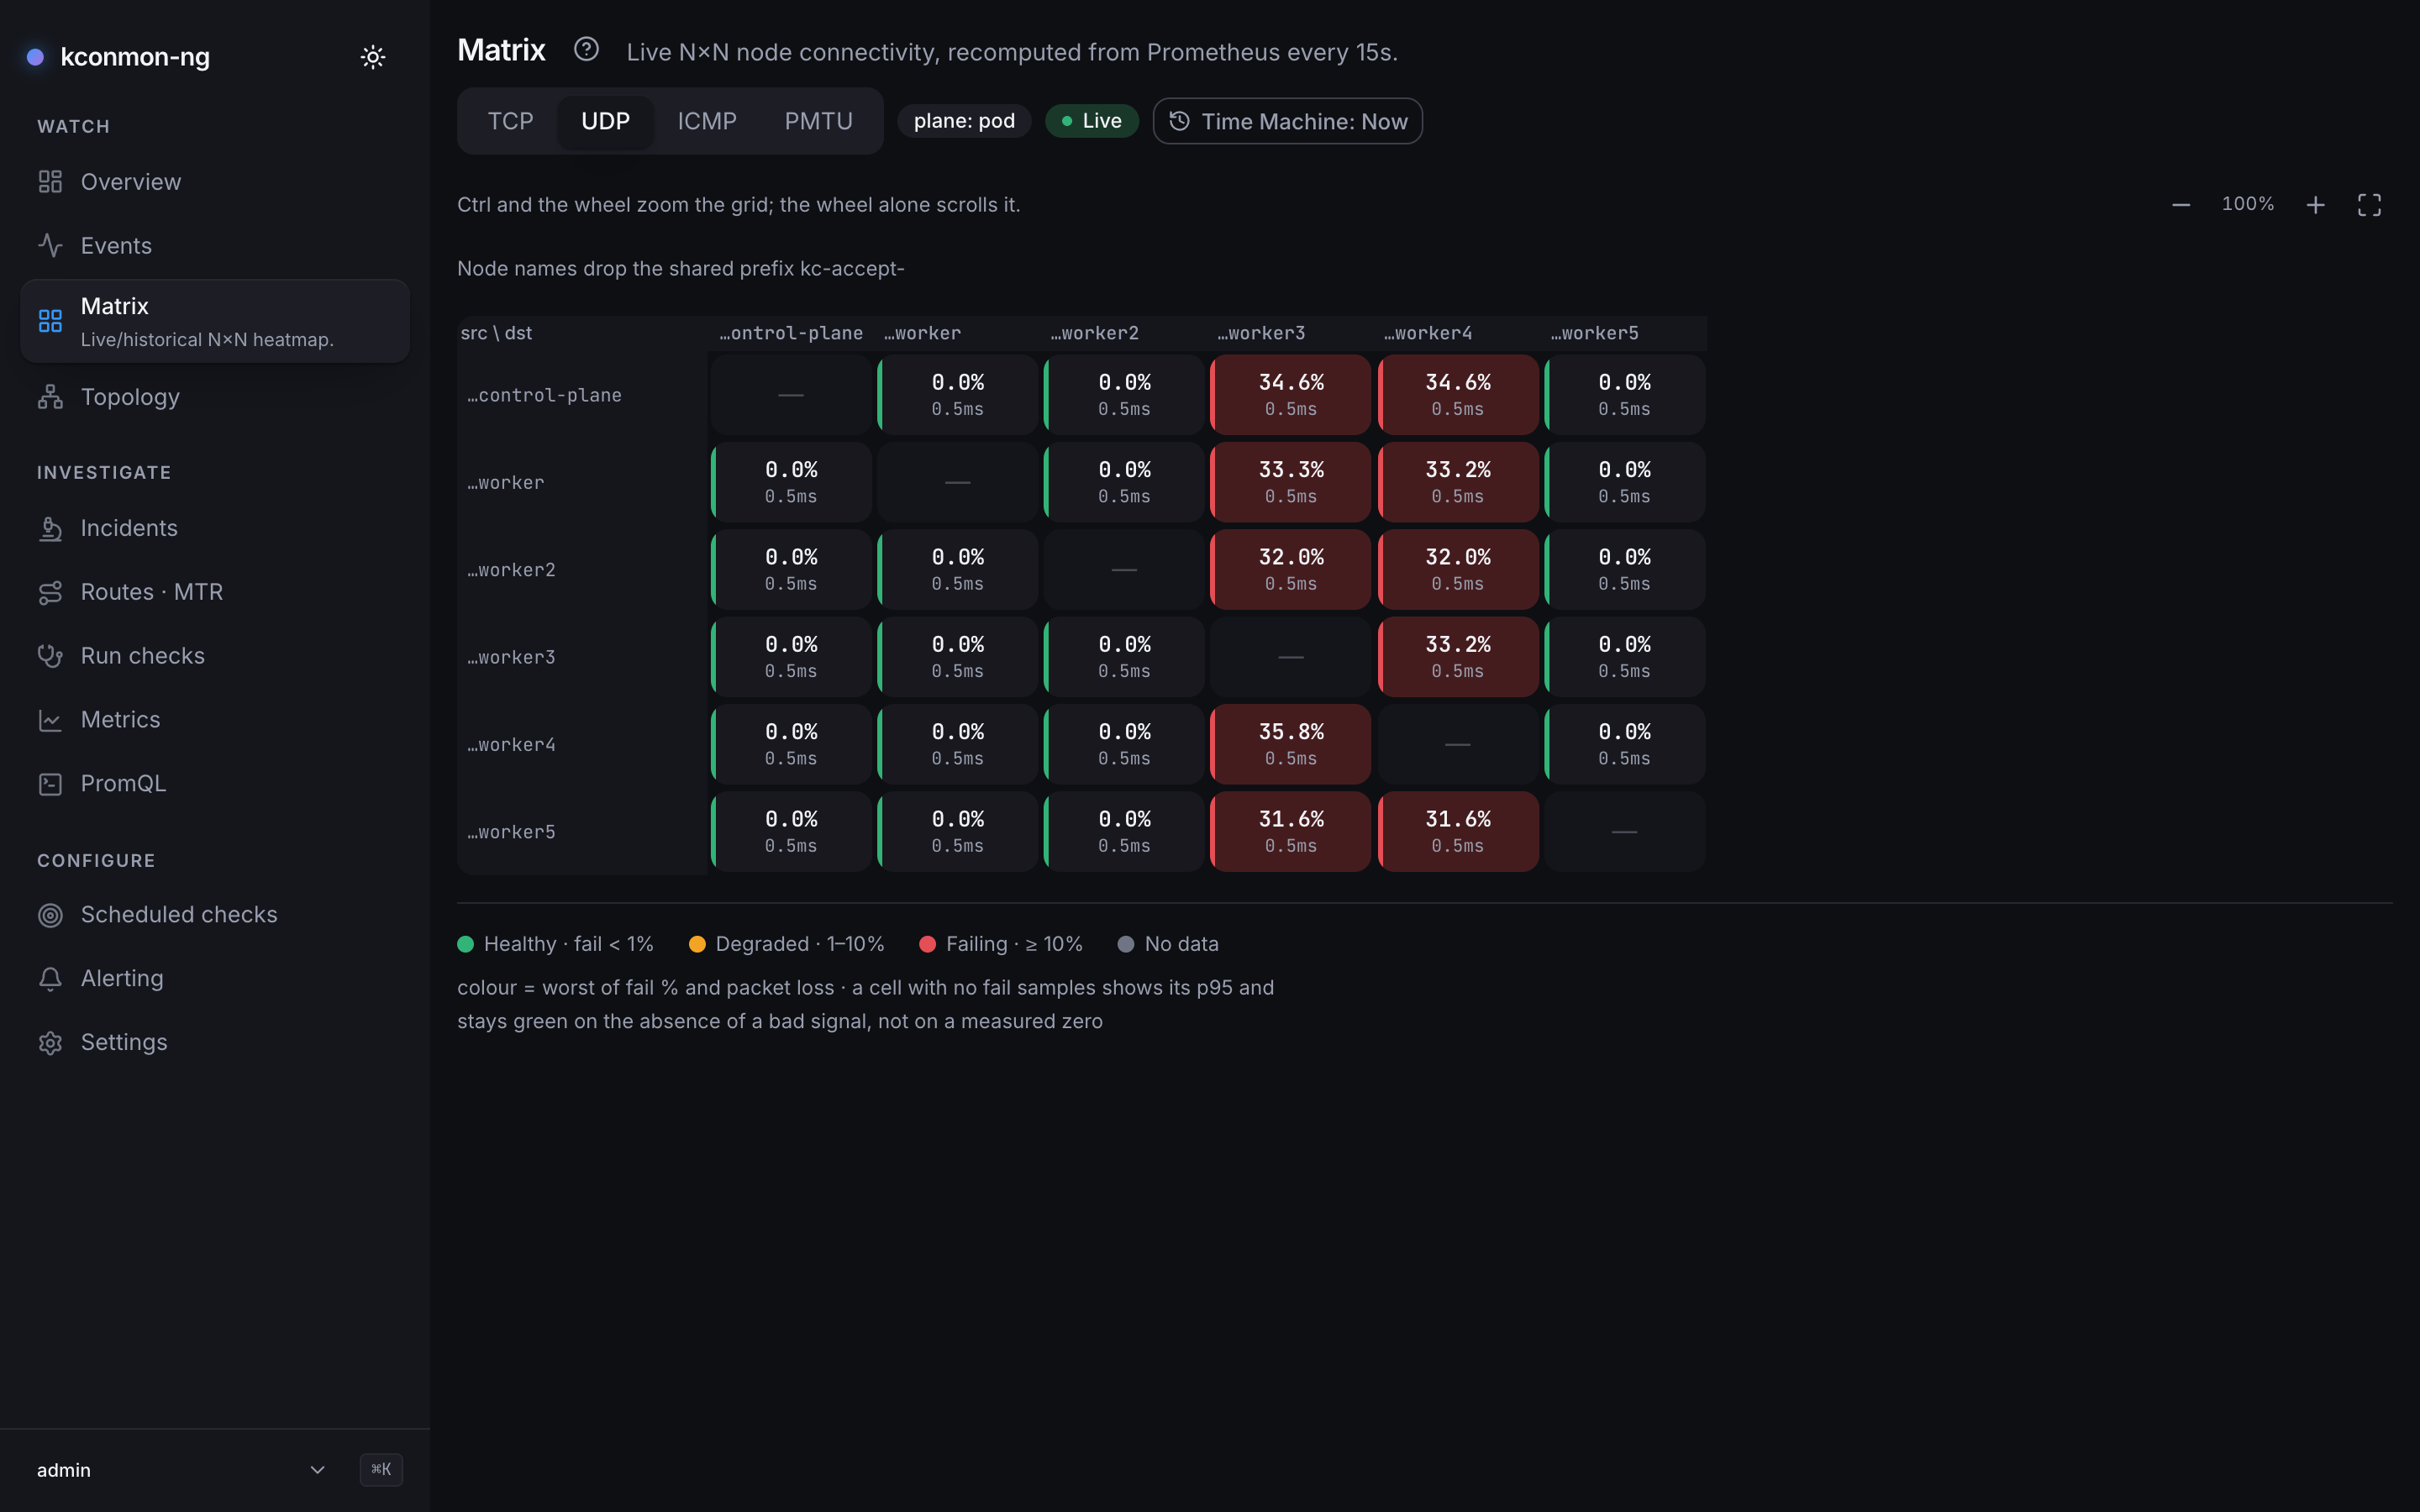
Open Matrix, protocol UDP. During this run it had one
failing cell out of 110, kconmon-stand-worker2 → kconmon-stand-worker6, read
out as packet loss 100.0%, the same single-cell failure the PromQL above
proves, without writing a query. The badge in the top bar reads Live while
the event stream is connected. Switch the protocol selector to TCP or ICMP and
all 110 cells read fail 0.0%: the Console is showing you the protocol
isolation, not just a red square. The frame below is a UDP-only blackhole at a larger scale on the same
stand, dropping UDP into worker3, worker4 and worker5:
Clicking the cell opens the pair page: both directed legs as badges in the header, the pair's RTT p95 by protocol over the last hour with its annotation and maintenance bars, an open-incident rail, and a "Recent changes" rail of the topology and diagnostic events around it.
Correlate it on /investigate
From the pair page, Investigate. The page arrives already scoped to
worker2 → worker6 over a window around now, and it assembles a merged
timeline from every source it has permission and data for: the threshold
crossing it derives from the loss series, the MTR path change, the diagnostic
runs, topology and K8s events, audit writes, maintenance windows, annotations,
and any firing alerts.
Slow down for two details here:
- The candidate-causes panel ranks by documented arithmetic, not by
cleverness: class weight times a linear decay over the five minutes before
onset. A path change outranks a config write outranks a maintenance window,
and the threshold crossing itself scores zero, since a symptom is not its own
cause. The weights are plain exported constants in the scoring source
(
web/src/lib/investigation.ts), and the panel links straight to them. - Sources you have not enabled say so. With
kubernetesContextoff, the K8s-events row is one muted line naming the flag, not a silent absence you could read as "nothing happened in the cluster".
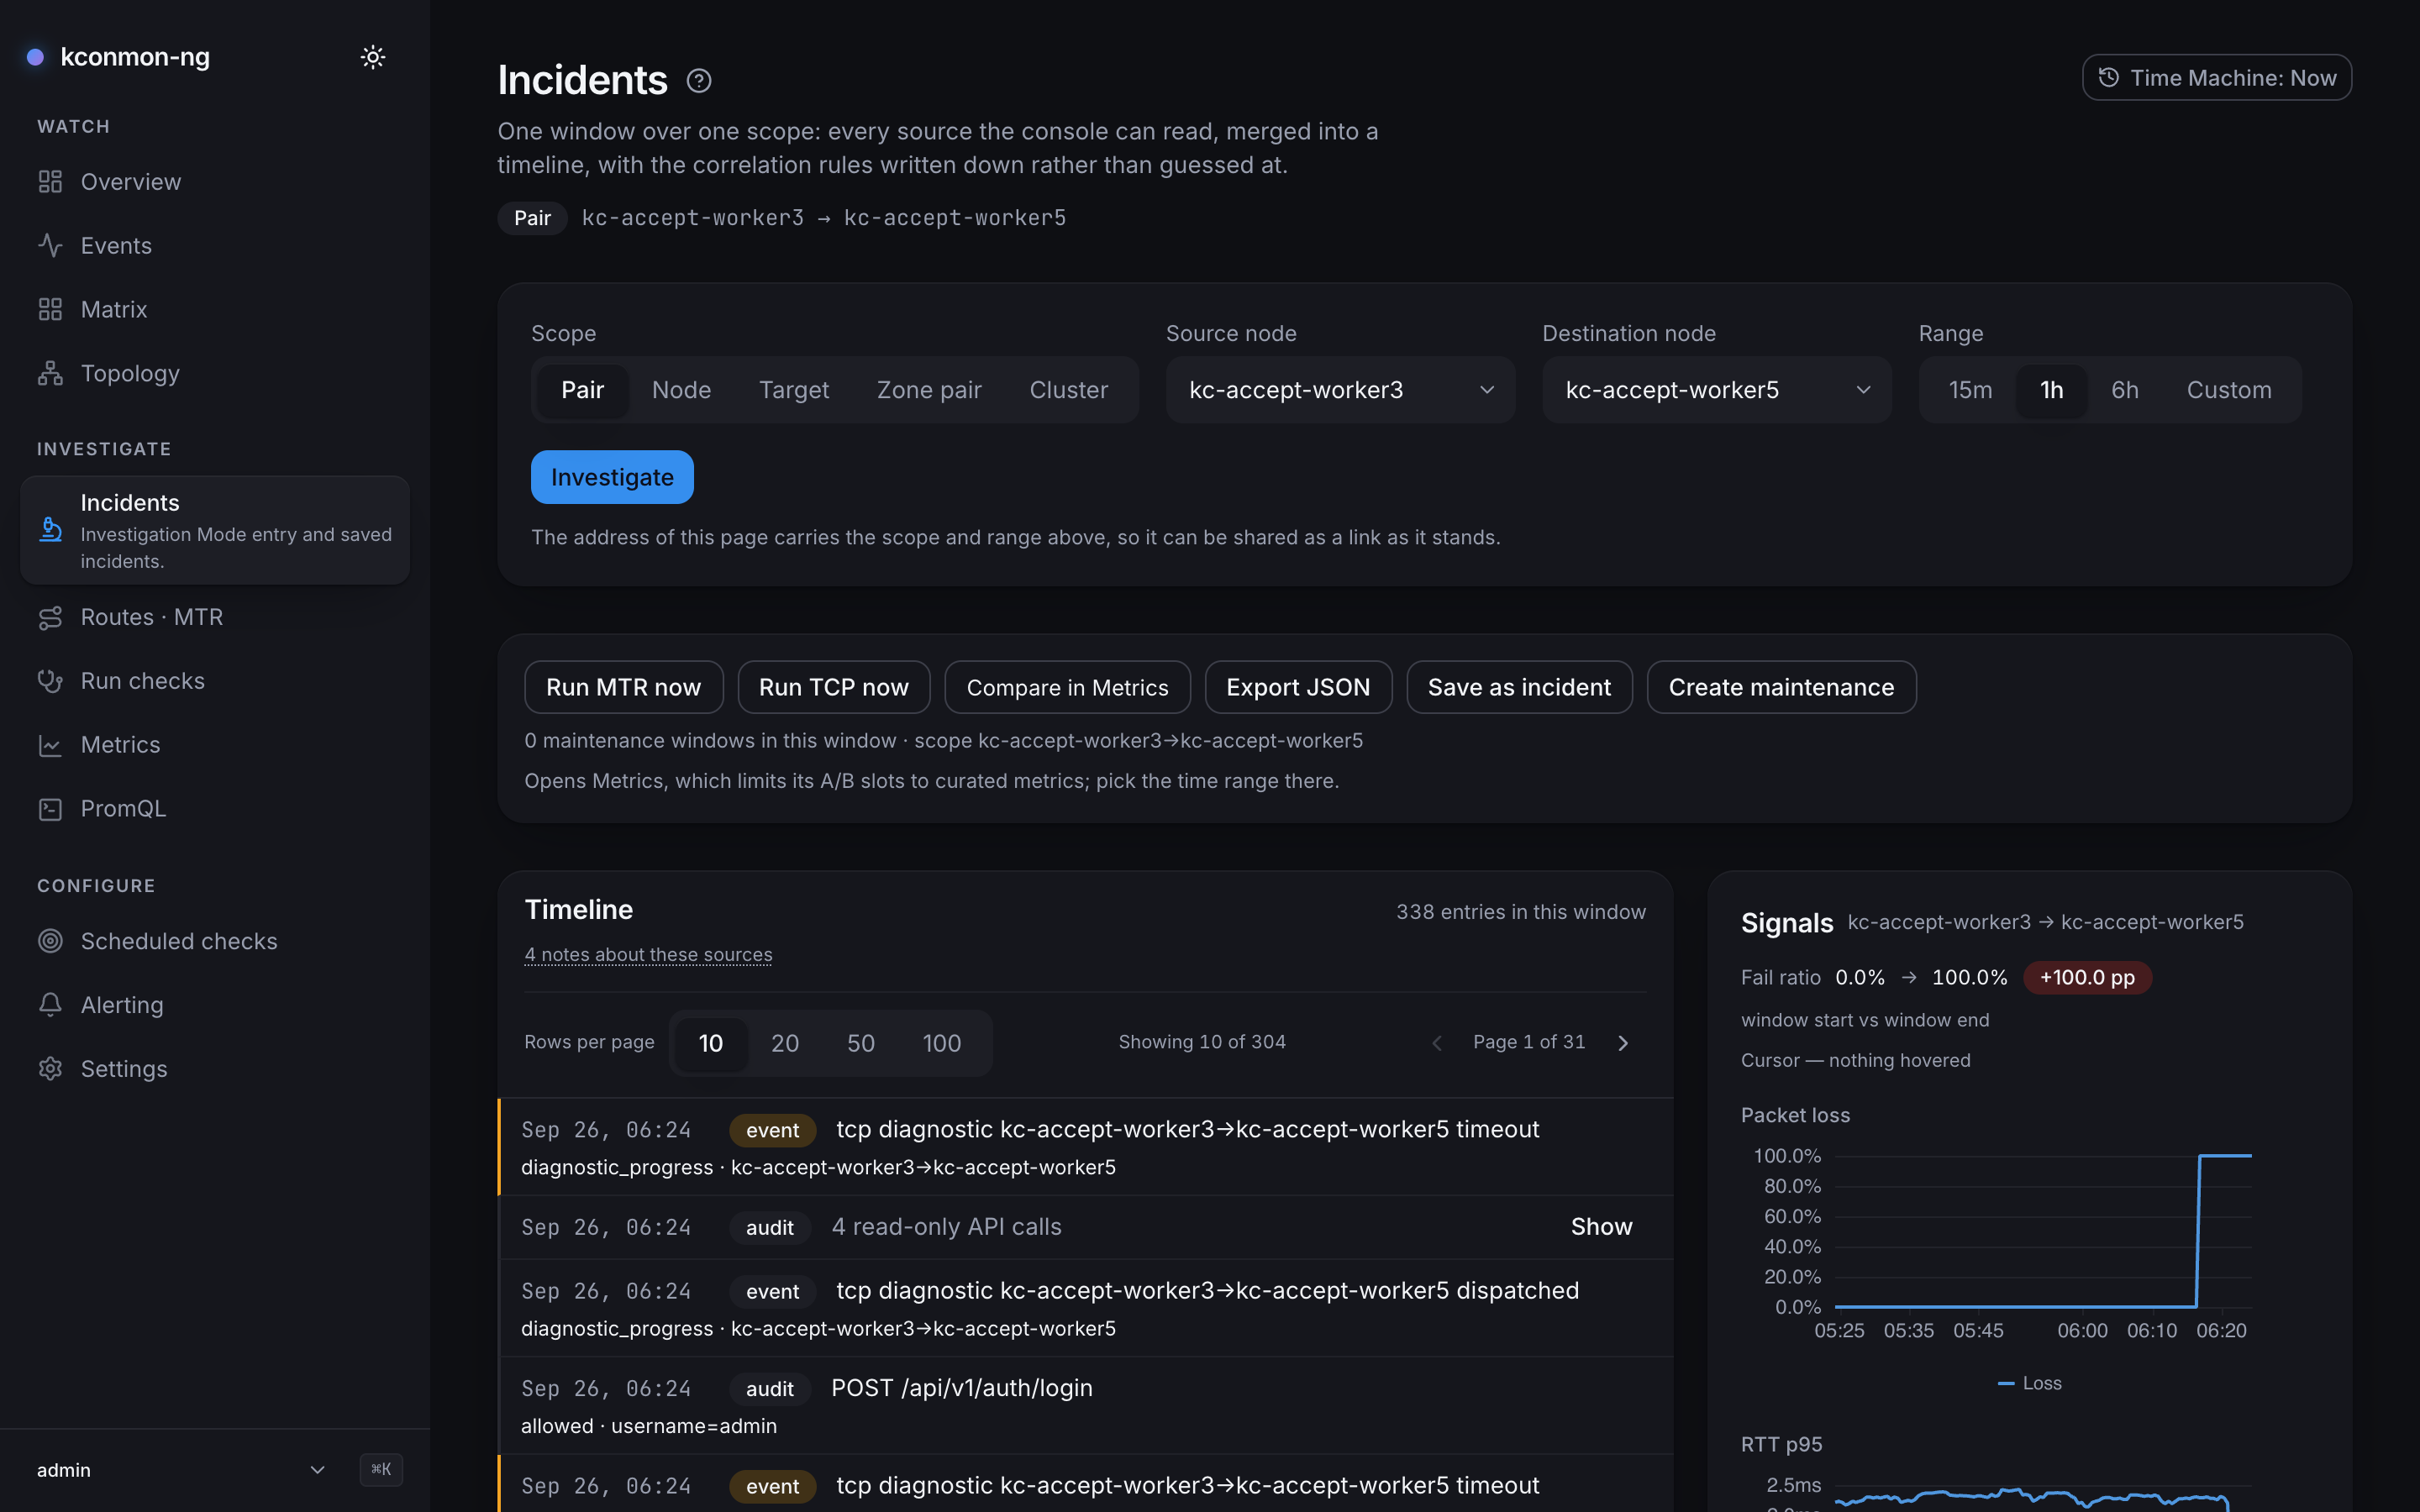
In this demo the honest answer is that nothing in the timeline caused it: you typed an iptables rule on a node, and the Console has no source that sees that. That is the correct outcome to see once: the ranking does not invent a culprit when there is none.
Press Save as incident, give it a title, and the incident appears on Overview with a permalink that rehydrates this exact scope and window.
Declare an alert rule for it
Open Alerting → New rule:
- Kind:
pair-loss - Protocol:
udp - Threshold:
50(percent: the builder takes operator units and converts to the metric's ratio at render time) - Scope: source
kconmon-stand-worker2, destinationkconmon-stand-worker6 - For: leave it blank. The
5min the box is only a placeholder, and blank fires as soon as the expression holds, which suits a demo that should not outlast your patience - Severity:
warning
The preview panel renders the PromQL and runs it against Prometheus right now, reporting how many series it currently matches. That is the validation: there is no expression parser in this codebase, so "is this valid" is answered by the server that will evaluate it. While the blackhole is in place the preview matches the pair; after you revert it matches nothing.
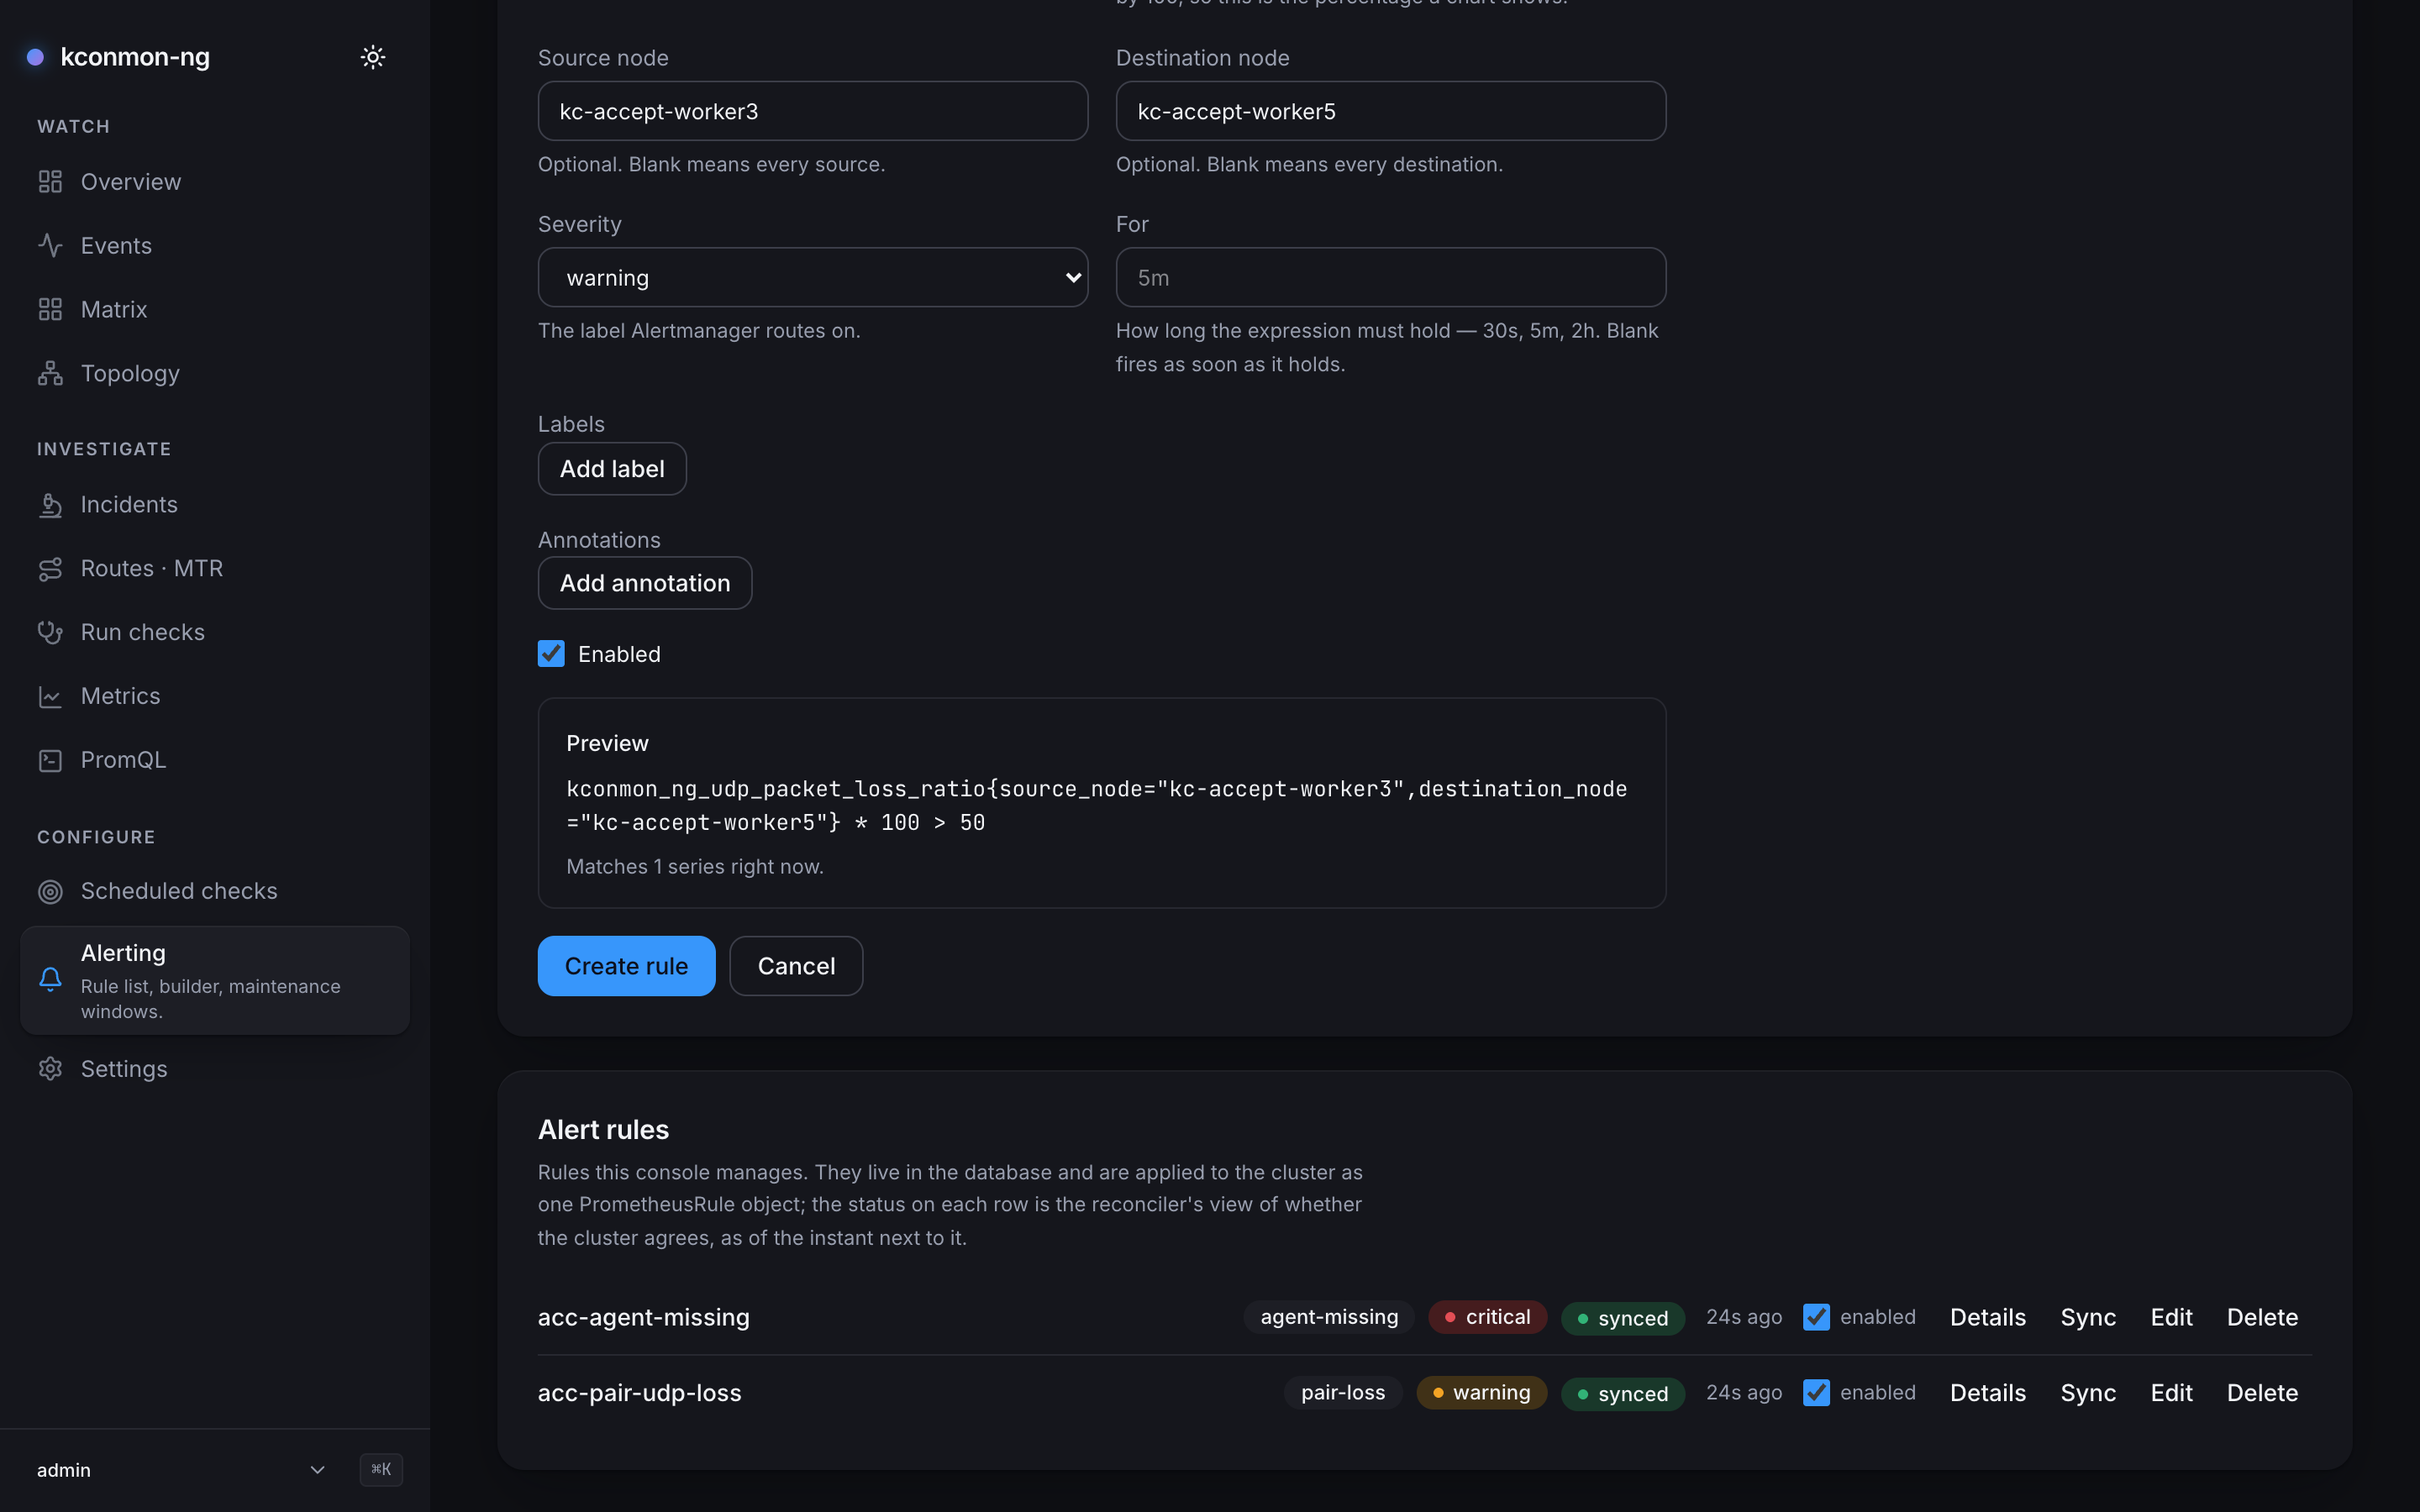
for left blank at its 5m placeholder, labels, annotations, Enabled, and the Preview panel rendering the pair-loss expression for worker3 → worker5 while worker5's agent is cut off. It matches 1 series right now, which is the pair; once the break is reverted the same preview matches 0, reported as an answer rather than a failure.Save. The Console renders every enabled rule into one PrometheusRule
object and server-side-applies it:
The rule row shows synced with a timestamp. Prometheus picks the object up on
its next config reload, and the Overview page's firing-alerts card shows it
once the for window elapses. The card leaves pending alerts out on purpose:
inside for, nothing has fired. GET /api/v1/alerts answers both states, so
a script polling it sees the rule as pending first, then firing.
If the row shows error instead, the message's first word is the cause class:
crd-missing (no Prometheus Operator), forbidden (the Role did not apply),
or other. The rule stays in the database either way: a failed sync costs you
the alerting, not the rule.
Get it delivered
Settings → Webhooks → add an endpoint pointed at anything that will accept
a POST, with alert.fired and alert.resolved selected. Test sends an
incident-shaped probe that answers "can I reach you", and the row records the
outcome verbatim.
When the rule fires, the Console POSTs a signed payload with
X-Kconmon-Signature: sha256=…, an HMAC over the exact body bytes. When it
stops firing, an alert.resolved follows with a resolvedAt. The full payload
schema, the retry ladder, signature verification and the properties to know
before wiring a pager (resolution precision, every-replica delivery, the dedupe
tuple) are all in
Set up alerting;
the demo only needs the endpoint to exist.
Adopt rules you already have
If your cluster already has hand-written PrometheusRule objects in this
namespace, Alerting → Foreign rules lists them read-only, and Import
copies one into the builder. It never touches the object it read, which means
that until you delete one of the two, the same alerts now exist twice and
both evaluate. The import report says so, and lists every rule it skipped
(recording rules, unparseable for values, names already taken) with the
reason.
Revert and recovery
Remove the rule:
docker exec kconmon-stand-worker6 iptables -D FORWARD -p udp \
  -s 10.244.13.2 -d 10.244.2.2 --dport 9090 \
  -j DROP -m comment --comment kconmon-demo-udp-blackhole
Recovery is fast where it should be and slower where a window says so. The rule came out at 12:30:20 UTC, and on the stand:
- the worker2 → worker6 UDP loss gauge read 0 on the next sample, at 12:30:22;
UDPLossHighresolved about 15 seconds after the revert; its lastfiringsample inALERTSis at 12:30:34;- the UDP success ratio below runs over
[2m], so its worst pair stood at 50 at 12:31:20 and all 110 pairs were back at 100 by 12:32:20; - the Matrix cell took longest, since its fail ratio is a 5-minute window: it drained a little every few seconds and the UDP matrix was clean again at 12:35:21.
Revert inside the 5-minute hold and UDPLossHigh clears without ever reaching
firing. Confirm through Prometheus:
# UDP success per pair over the last 2m: every pair back at 100
sum by (source_node, destination_node) (rate(kconmon_ng_udp_results_total{result="success"}[2m]))
  / sum by (source_node, destination_node) (rate(kconmon_ng_udp_results_total[2m])) * 100
Going further: break a zone and two nodes at once
One broken pair proves isolation. A broken zone proves the picture still reads
when a third of the fleet goes dark. This break blackholes zone-c (worker6
and worker7) on TCP 8080, UDP 9090 and ICMP in both directions, and cuts the
agents on worker2 (zone-a) and worker5 (zone-b) off the mesh on the same
three protocols. The rules live in a chain of their own, hooked first into
FORWARD, so cleanup never touches the CNI's rules. The stand's own pods
(Console, webhook sink, Prometheus, Postgres) get RETURN rules above the drops,
so the page you are watching keeps answering even though the webhook sink sits
on worker6:
NS=kconmon-ng
KEEP=$(for sel in app.kubernetes.io/component=console app=hooks-sink \
                  app=kconmon-stand-prometheus app=kconmon-e2e-postgres; do
  kubectl -n $NS get pods -l "$sel" -o jsonpath='{.items[*].status.podIP} '; done)

chain() {  # chain <node>: create KCONMON_DEMO, hook it into FORWARD, exempt the stand's pods
  docker exec "$1" sh -c 'iptables -N KCONMON_DEMO 2>/dev/null; iptables -C FORWARD -j KCONMON_DEMO 2>/dev/null || iptables -I FORWARD 1 -j KCONMON_DEMO'
  for ip in $KEEP; do
    docker exec "$1" iptables -A KCONMON_DEMO -s "$ip" -j RETURN
    docker exec "$1" iptables -A KCONMON_DEMO -d "$ip" -j RETURN
  done
}
drop() {  # drop <node> <address or CIDR>: TCP 8080, UDP 9090 and ICMP, both directions
  for dir in -s -d; do
    docker exec "$1" iptables -A KCONMON_DEMO $dir "$2" -p tcp --dport 8080 -j DROP
    docker exec "$1" iptables -A KCONMON_DEMO $dir "$2" -p udp --dport 9090 -j DROP
    docker exec "$1" iptables -A KCONMON_DEMO $dir "$2" -p icmp -j DROP
  done
}

# zone-c: every pod on worker6 and worker7
for n in kconmon-stand-worker6 kconmon-stand-worker7; do
  chain "$n"; drop "$n" "$(kubectl get node "$n" -o jsonpath='{.spec.podCIDR}')"
done

# the agents on worker2 and worker5
for n in kconmon-stand-worker2 kconmon-stand-worker5; do
  chain "$n"
  drop "$n" "$(kubectl -n $NS get pods -l app.kubernetes.io/component=agent \
    --field-selector spec.nodeName="$n" -o jsonpath='{.items[0].status.podIP}')"
done
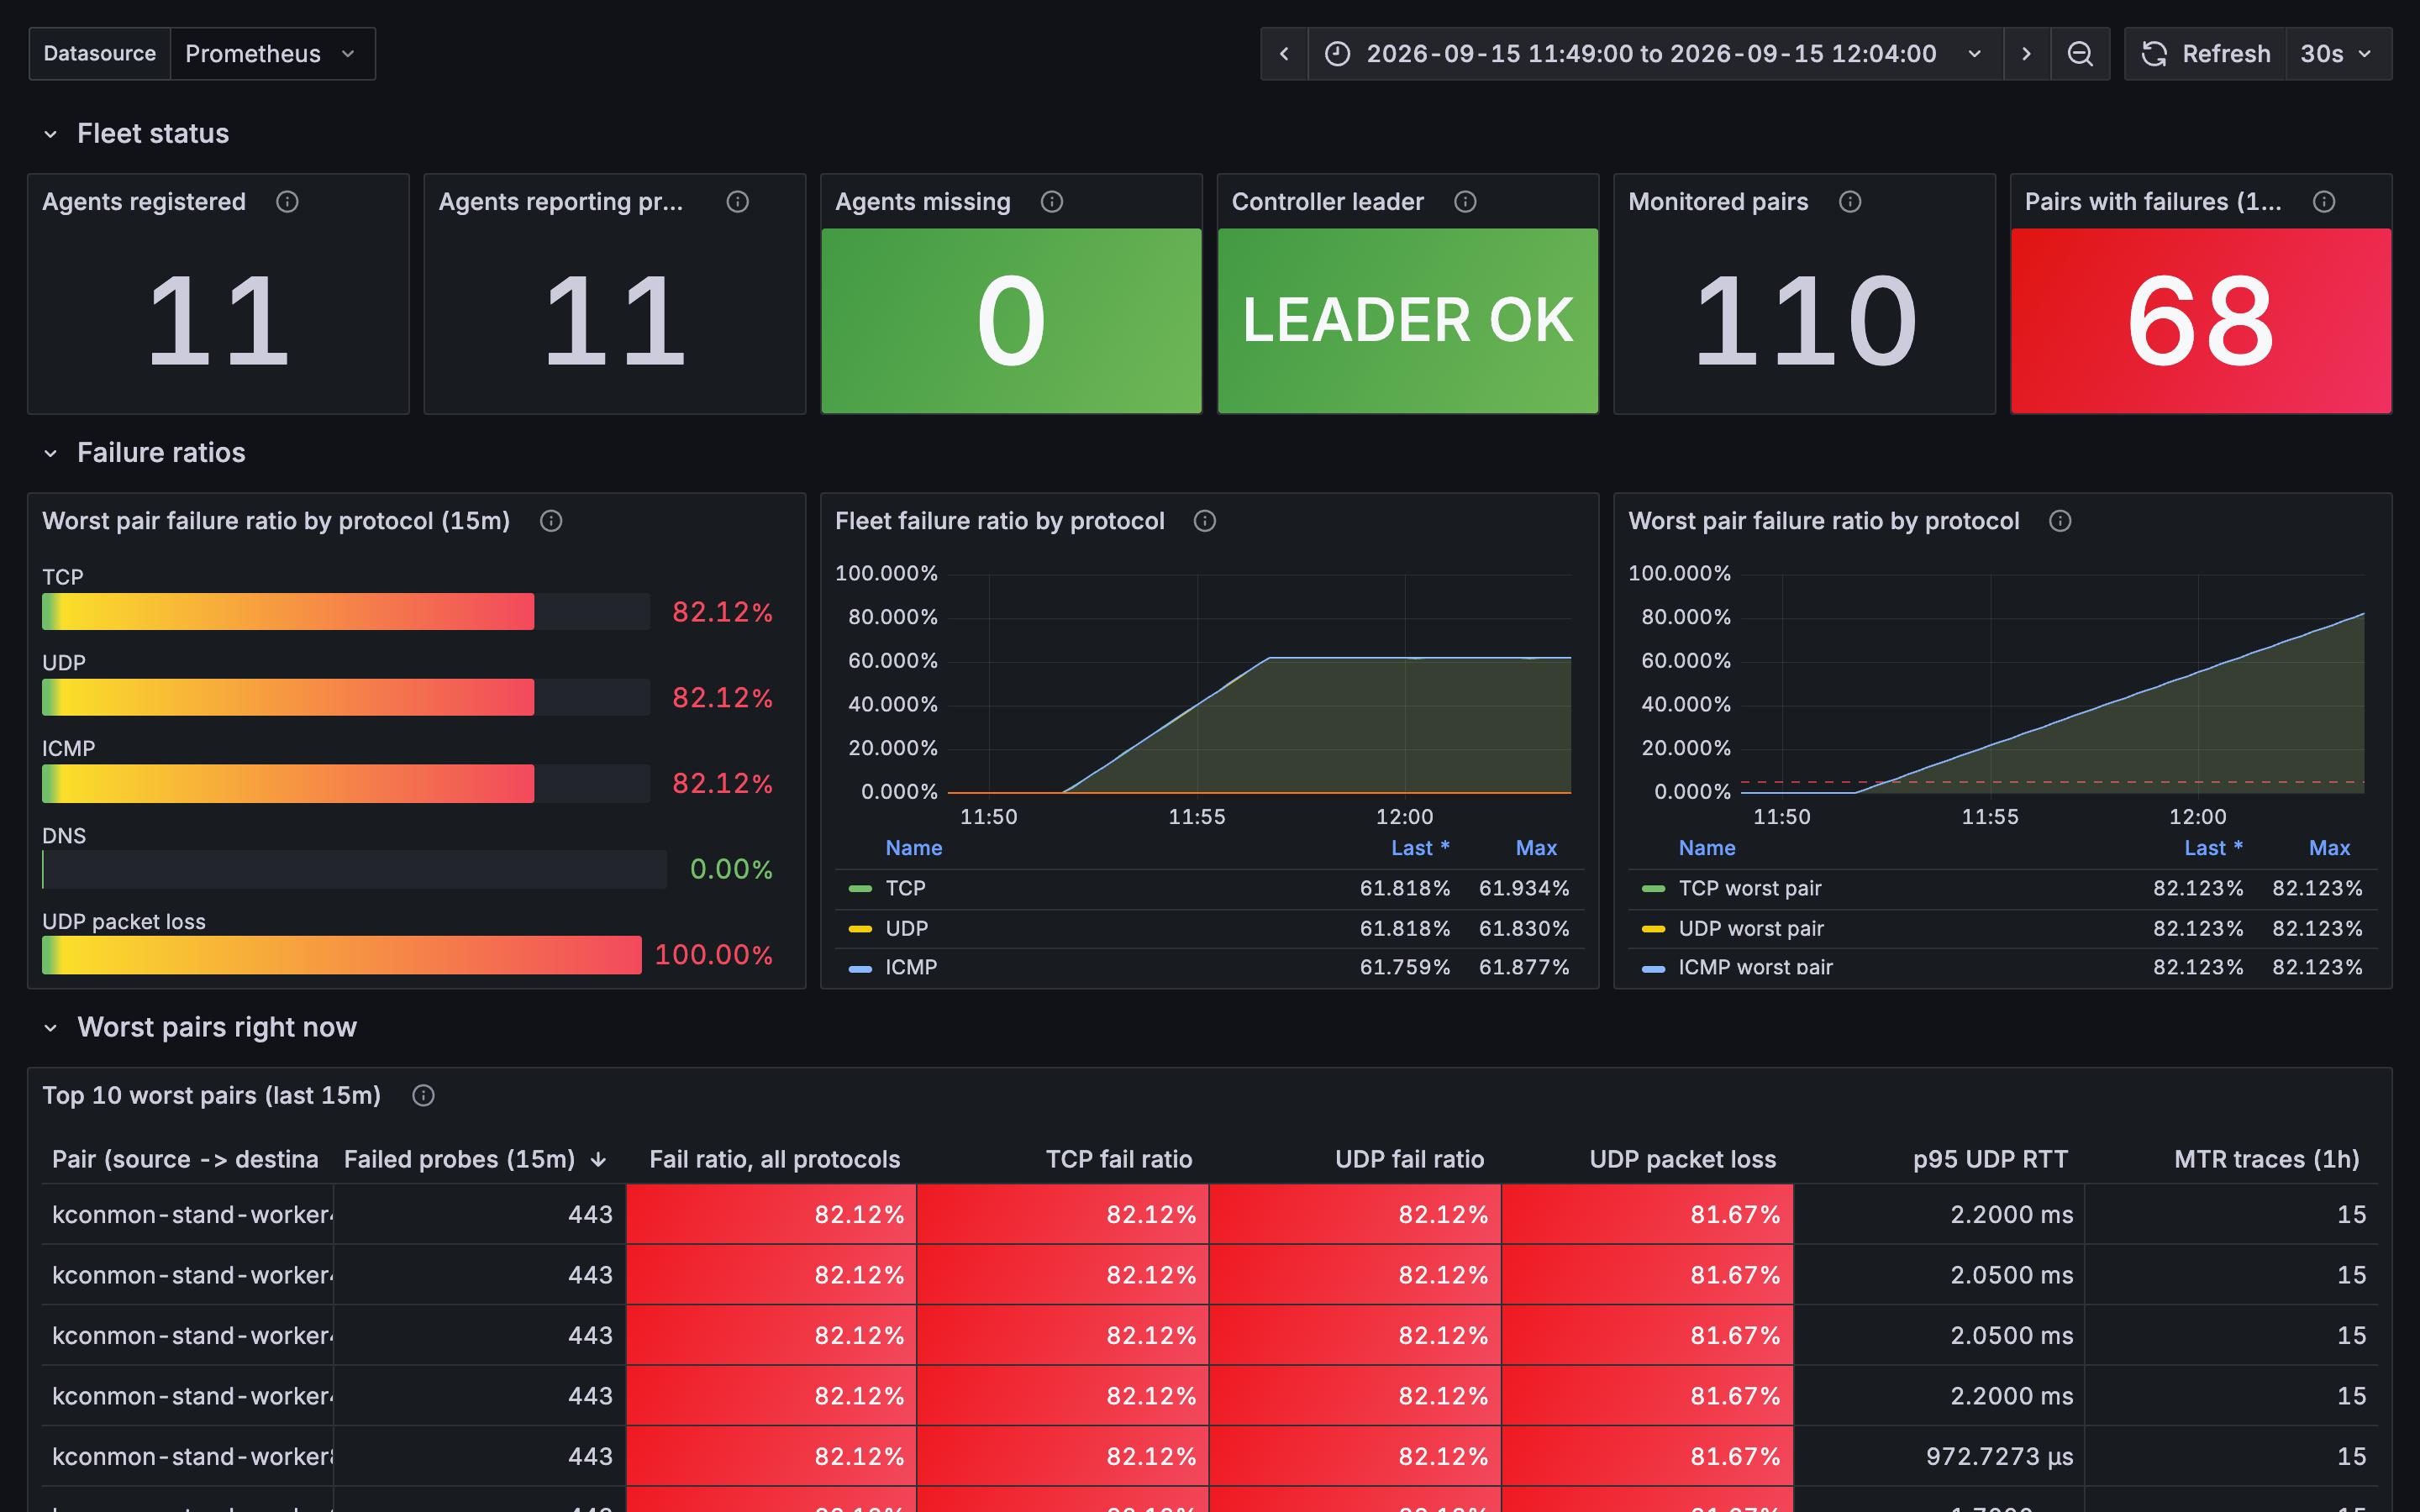
The stand staged it at 11:51:43 UTC. By 11:52:00 Prometheus counted 68 of the
110 directed pairs failing, on TCP, UDP and ICMP alike and spread over 21 zone
pairs, and the count held at 68 for as long as the rules stayed. The other 42
pairs, the ones among the seven untouched agents (control-plane, worker,
worker3, worker4, worker8, worker9 and edge-host-01), never failed a
probe. A third of the fleet dark, and the overview still says exactly how much:
Cleanup
Remove what you added and verify no demo rules remain on any node (leftover DROP rules will quietly break your next run):
for n in $(kubectl get nodes -o jsonpath='{.items[*].metadata.name}'); do
  docker exec "$n" sh -c 'iptables -D FORWARD -j KCONMON_DEMO 2>/dev/null; iptables -F KCONMON_DEMO 2>/dev/null; iptables -X KCONMON_DEMO 2>/dev/null
    iptables -S | grep -E "kconmon-demo|KCONMON_DEMO" || echo "$(hostname): clean"'
done
Tear the whole stand down when finished:
What this proves
"Can worker2 reach worker6?" was yes for the whole run: TCP and ICMP between those two nodes never stopped. Ask only that question and this outage stays invisible while every UDP workload on the pair quietly fails.
The run answered the question you actually need:
- which protocol: UDP, with TCP and ICMP proven healthy on the same pair;
- which node pair: worker2 → worker6, with the other 109 pairs proven unaffected;
- which hop: captured by the MTR trace that fired on its own;
- and it alerted on sustained loss, from a rule that ships with the chart.
Four facts, no SSH, no guessing.
Further experiments
- Latency injection (not covered in this validated run):
tcis on the kind nodes (/usr/sbin/tc), andtc qdisc add dev <iface> root netem delay 100msmakes the RTT panels react without any loss, a clean demo of latency-vs-loss separation, provided the host kernel hassch_netem. Apply it narrowly and revert withtc qdisc delpromptly: node-level netem affects all traffic on the interface, kubelet and apiserver included. - DNS-only failure: block egress to the cluster DNS service and watch
kconmon_ng_dns_results_total{result="fail"}andDNSChecksFailingreact while TCP/UDP/ICMP peer checks stay green.