PromQL
Ad-hoc queries against the same Prometheus the rest of the console reads from. When a curated chart is close but not quite the cut you need, or you are drafting an alert expression and want the series count before saving a rule, write it here and run it; no Grafana required.
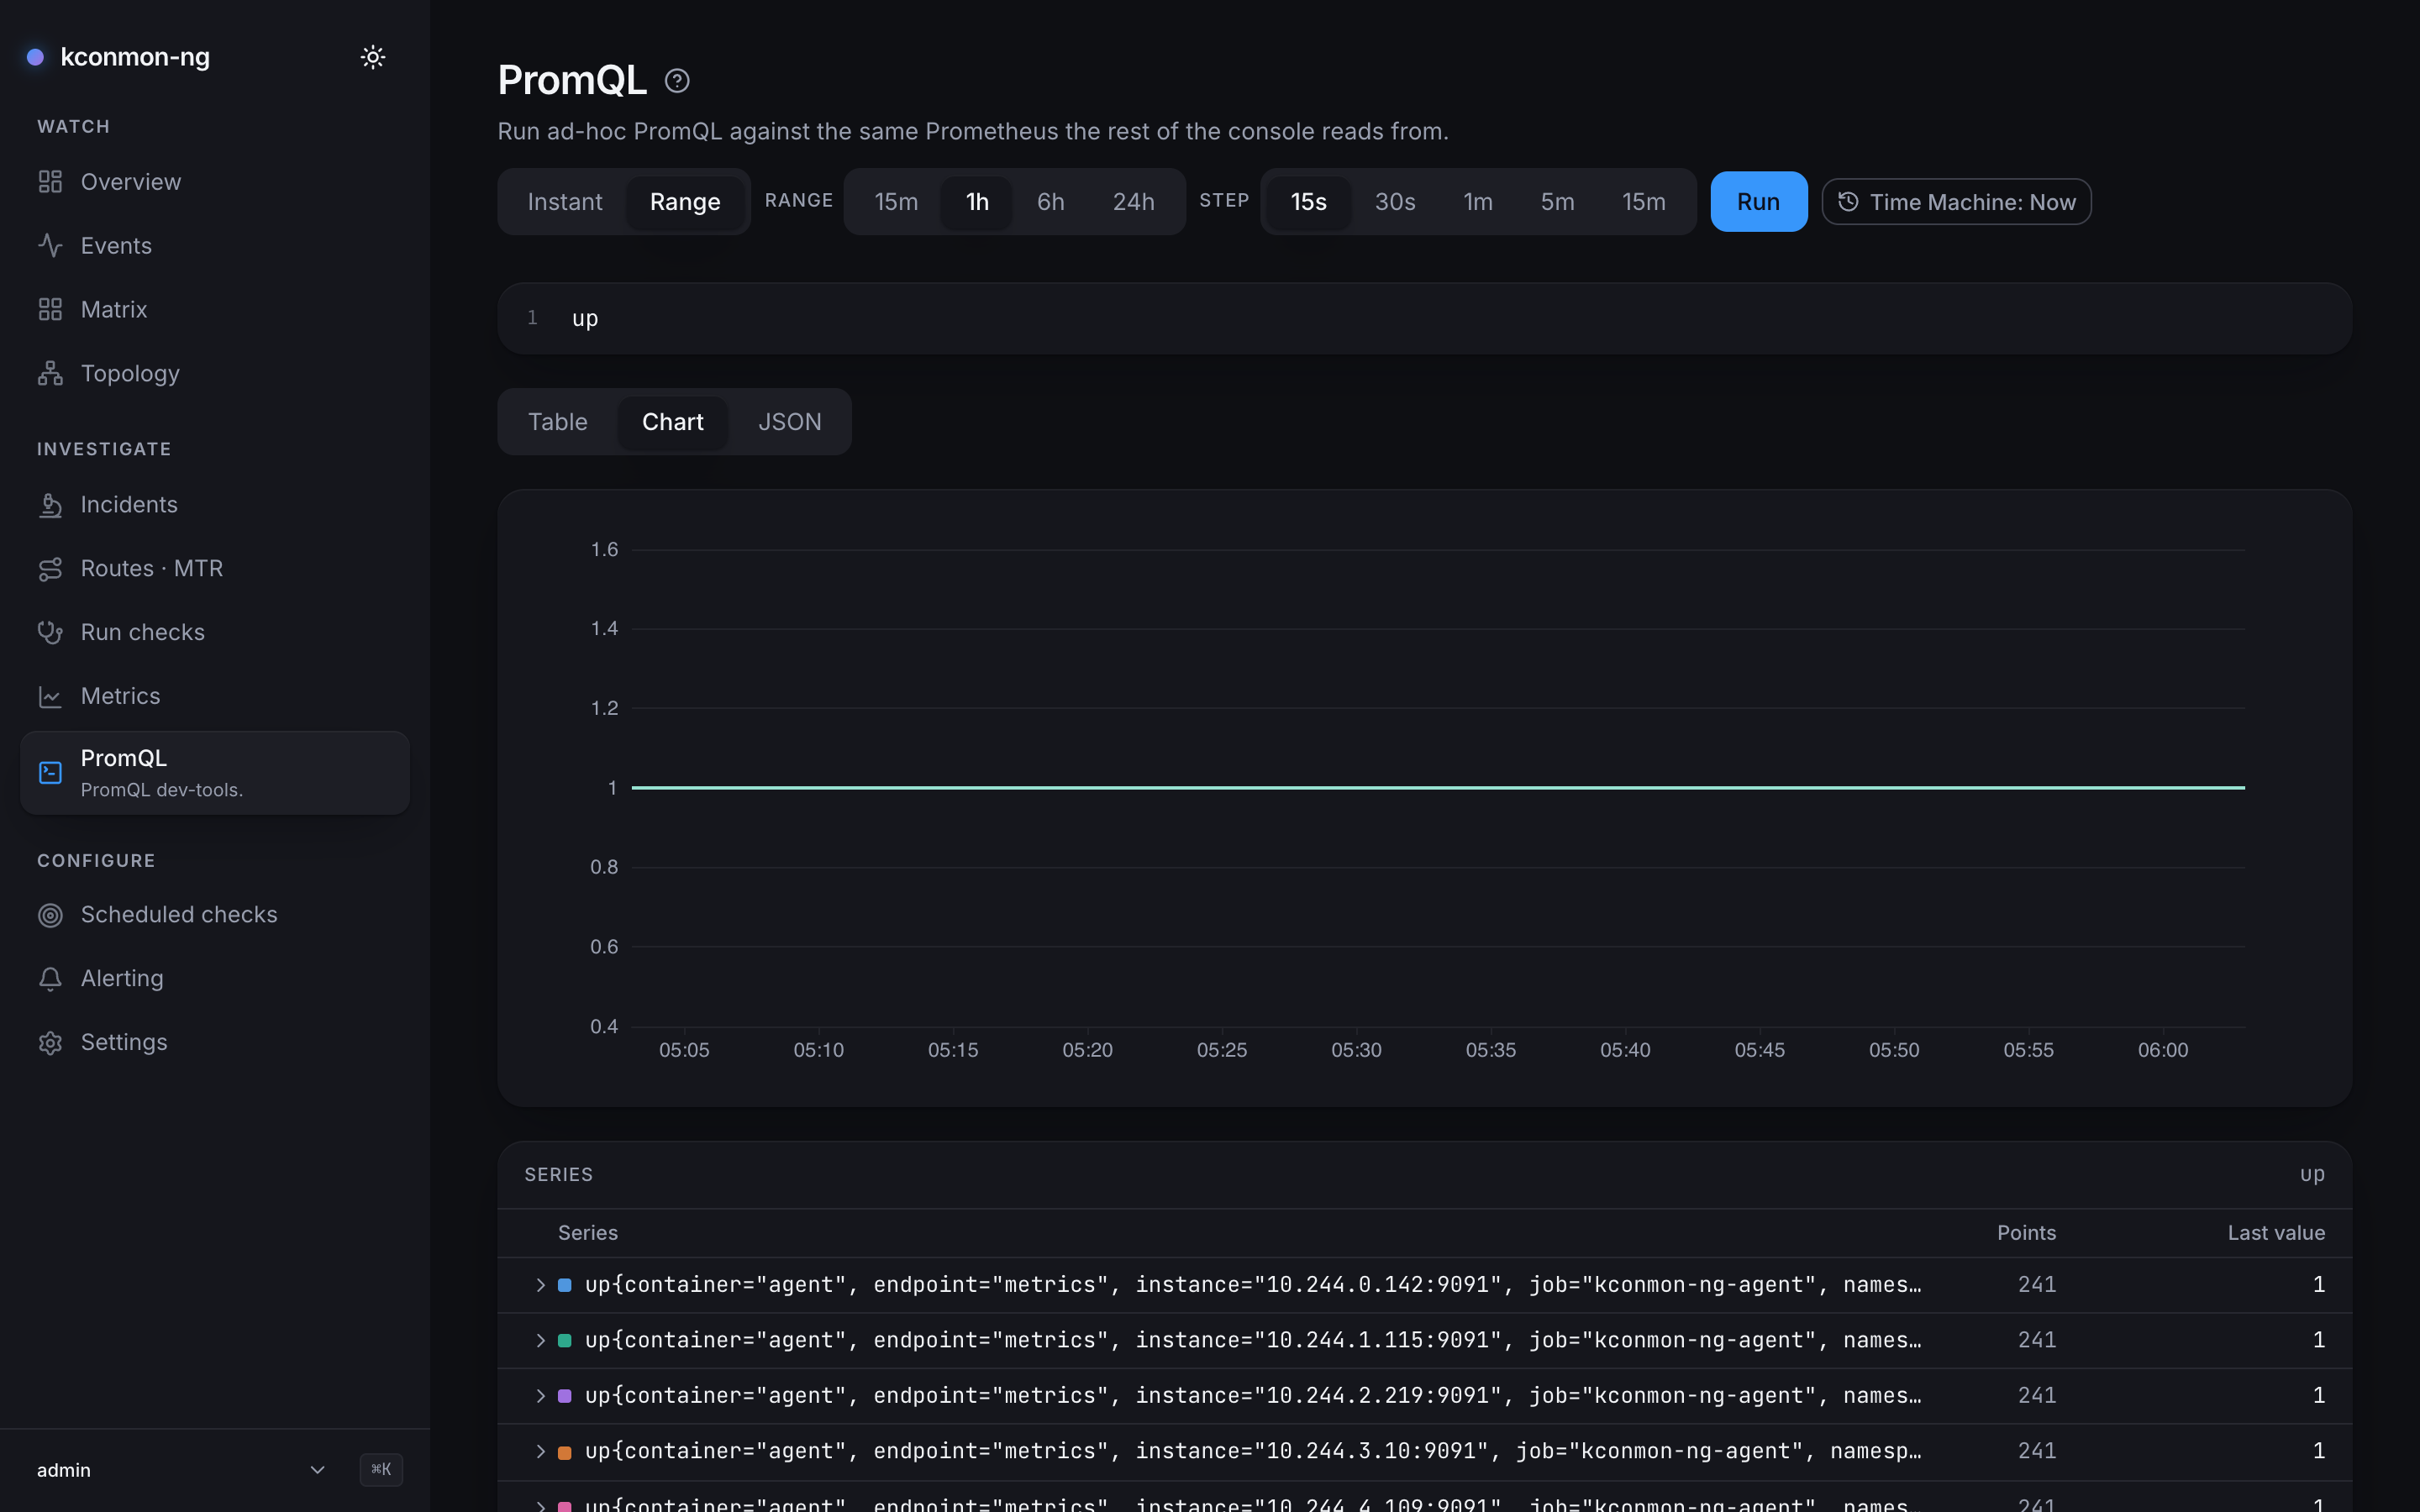
up over the last hour at a 15s step, every target flat at 1, and the series table underneath with points and last value per series, the kconmon agent targets first.The editor
A CodeMirror PromQL editor with three result views under it.
- Run executes the query; so does Cmd+Enter / Ctrl+Enter in the editor.
- Query mode: Instant or Range. Range mode adds Range (
15m/1h/6h/24h) and Step (15s/30s/1m/5m/15m). Unlike Metrics, the step is yours to control; a suggested step targeting about 240 points per series is preselected. - The last query is remembered in this browser.
- Inside the editor, Cmd+K / Ctrl+K still opens the command palette; the page re-binds it away from CodeMirror's default.
Result views: Table, Chart, and JSON (the raw Prometheus envelope). The Table leads with the figures: the value of an instant result, or the last value and the point count of a range, then the label columns that distinguish the series. Every value carries its read time: once above the table ("Read at {at}", "Last values, read at {at}") when all rows share it, or as a time column when they do not. Each row expands with Show all labels to the full label set. The Chart tab disables itself when the result has no series over time to draw, and its tooltip says what a chart needs: "A chart needs several points per series over time; a query run as Range returns them". The block follows the result, not the query mode, so an instant query that returns a matrix (such as up[5m]) still charts. Chart time-axis ticks print HH:mm, and HH:mm:ss for a tick between whole minutes, so a range of a minute or two does not repeat one label. Prometheus's own error text renders verbatim.
With the Time Machine engaged, instant queries are evaluated at the viewed instant and a range ends there.
Guardrails
Queries go through the console's guarded proxy (POST /api/v1/promql/query and /query_range), gated on the promql:query permission, and the guards answer in words when they bite:
- Range:
console.prometheus.maxRange, default24h. A longer range is a 422, "range exceeds maximum". - Response size:
console.prometheus.maxResponseBytes, default 8 MiB (8388608). A result past the cap is a 422 titled "result too large", telling you to narrow the query or shorten the range. High-cardinality selectors over long ranges are what usually hits it. - Time:
console.prometheus.queryTimeout, default 30 s. - Rate:
console.rateLimit.promqlPerMinute, default 60 per subject per minute. The proxy forwards arbitrary PromQL to your Prometheus andpromql:querybelongs to the viewer role, so the budget exists. A throttled reply names the knob. Inanonymousmode every visitor is the same subject, so the budget is kept per client address instead; behind an ingress that is the real client only whenconsole.clientAddress.trustedProxyCIDRsnames the ingress controller's addresses, otherwise every visitor shares the ingress's budget. - Request body: the proxy decodes it strictly. A misspelt field is a 400 that names it (
unknown field "tme" -- check the field name against the API schema), and so is a body with a second JSON value or trailing data after it. - Upstream errors: Prometheus's own error answers (400, 422, 500 or 503 with
"status":"error") are passed through as they are. Any other upstream status, such as a 401 or 403 from an auth proxy in front of Prometheus or an HTML error page, becomes a 502 "prometheus error" naming the status Prometheus answered with.
With a custom config.metricsPrefix, the proxy renames the metric names in a query from kconmon_ng_* to the configured prefix, so the queries below and the console's own charts work unchanged. String literals, label matchers and grouping label lists are left alone. A prefix shorter than the default, such as kconmon, is rewritten like any other. A prefix that extends the default is the one known limit: a name already carrying it is left as it is, so with kconmon_ng_tcp the default kconmon_ng_tcp_results_total cannot be told apart from a renamed metric and is not rewritten. Pick a prefix whose extra word is not a metric family name (kconmon_ng_eu is fine).
Useful starting queries
The exported series are documented in Metrics and alerting; here are two starting points.
# TCP RTT p95 per pair over 5m
histogram_quantile(0.95,
  sum by (source_node, destination_node, le)
    (rate(kconmon_ng_tcp_total_duration_seconds_bucket[5m])))
# UDP packet loss ratio per pair (exported as a gauge)
avg by (source_node, destination_node) (kconmon_ng_udp_packet_loss_ratio)
The five curated charts on Metrics are themselves plain PromQL (web/src/lib/curated-metrics.ts); copy one here as a starting point.
Deep links
The raw alert-rule kind on Alerting stores hand-written PromQL. Prototype it here first; the rule builder's preview runs it through the same proxy, so what evaluates here evaluates there.