kconmon-ng
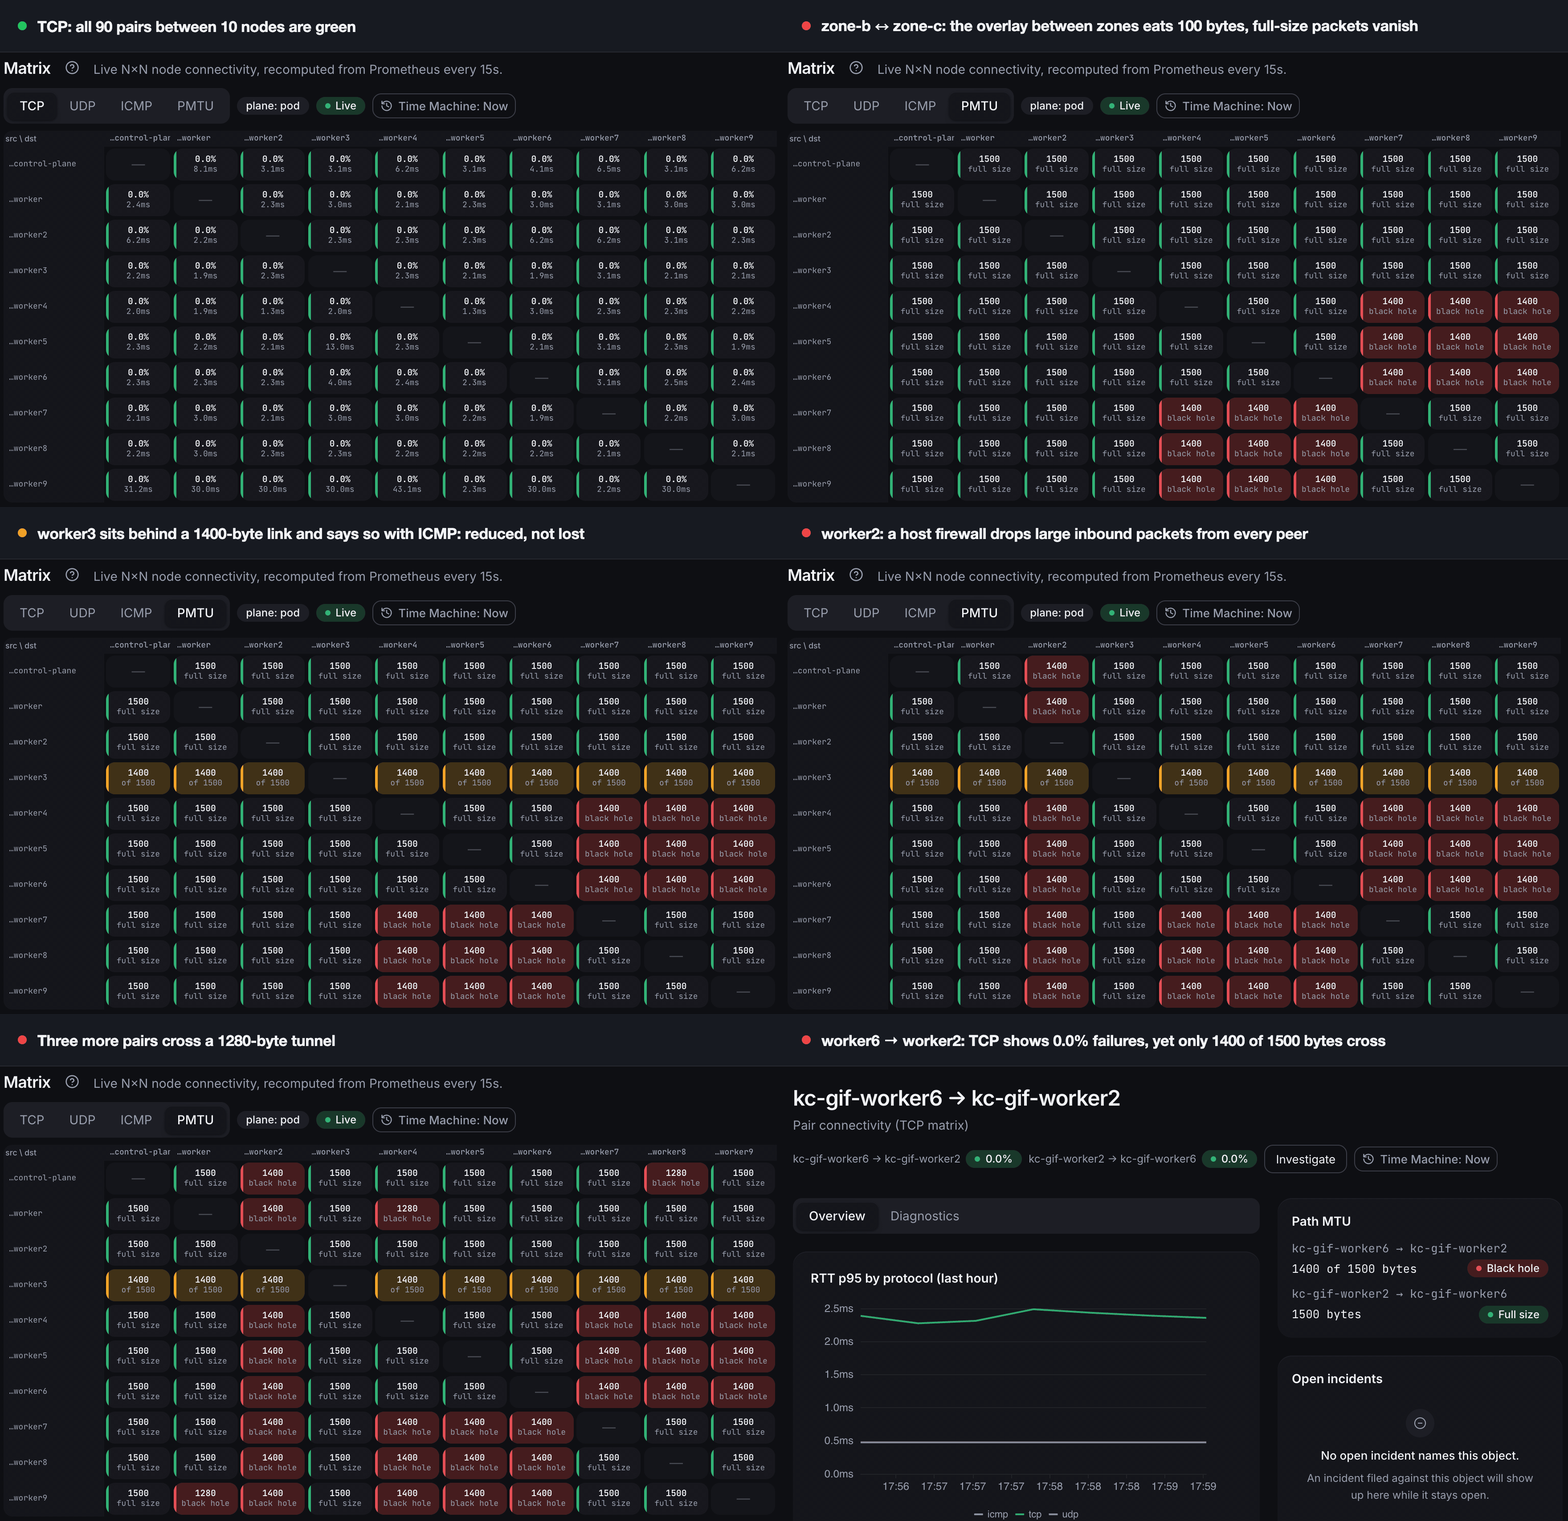
When someone says "the network is fine", answer with data.
kconmon-ng turns inter-node connectivity into a measured fact. An agent runs
on every Kubernetes node and probes every other node over TCP, UDP and ICMP
every five seconds, and once a minute checks that a full-size datagram with
Don't Fragment set still crosses each pair (the path MTU probe, since 2.5.0);
it also resolves DNS from each node and can check HTTP endpoints you
configure. Each probe is a specific act: a UDP probe sends a
burst of 5 packets with a 250 ms reply timeout and computes loss as sent
minus received over sent, while a TCP probe dials the peer with a 1 s
timeout. The default DNS check resolves
kubernetes.default.svc.cluster.local through the pod's own resolver, and
explicit upstreams can be named instead.
Every ordered node pair gets its own latency, jitter and packet-loss series, per protocol. A partial failure shows up as exactly that, instead of vanishing into a green aggregate: UDP dropping on one pair while TCP stays clean, or DNS timing out from a single node. When a TCP, UDP or ICMP probe fails, the agent fires an MTR trace to that peer, so the bad hop is on record before anyone starts looking. One caution before a big rollout: pairs grow as N×(N−1) and each directed pair keeps 78 series, so read Scaling and cardinality before pointing this at a large cluster.
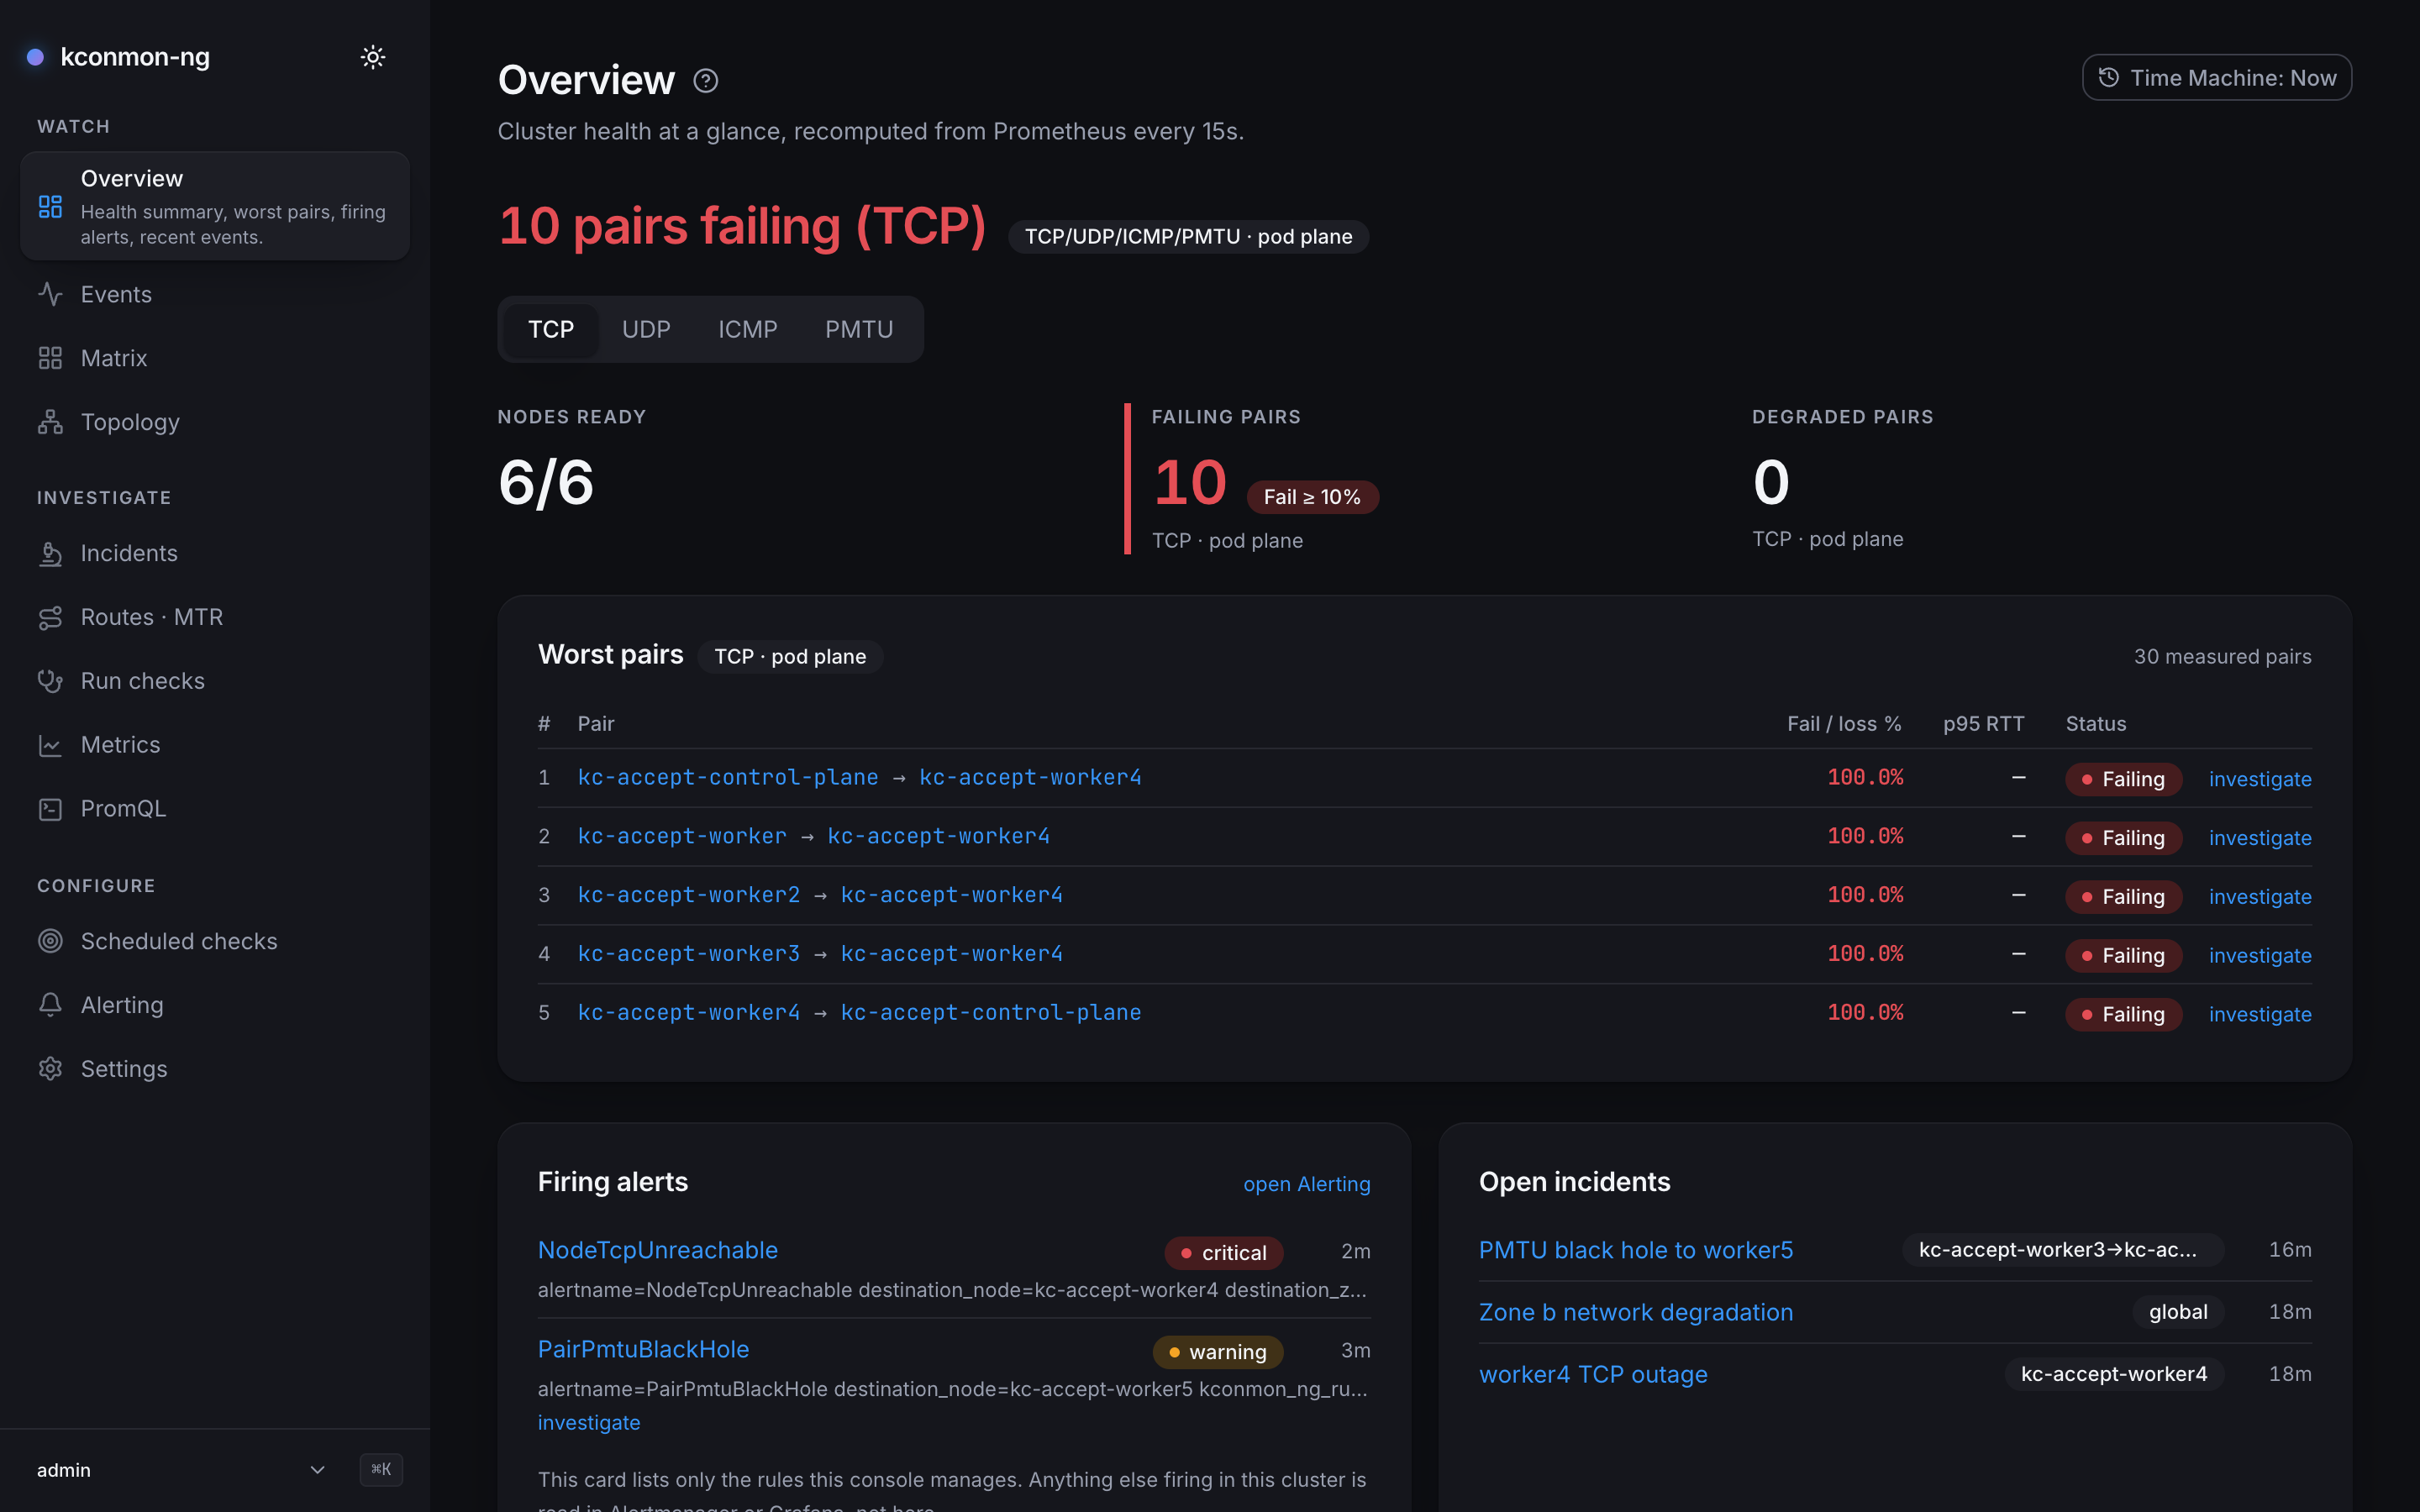
On top of the measurements sit an N×N matrix, a topology map, MTR path
history, incident timelines, Prometheus-evaluated alert rules, and a Time
Machine: a ?at= on the URL rewinds every console page to the minute it
broke.
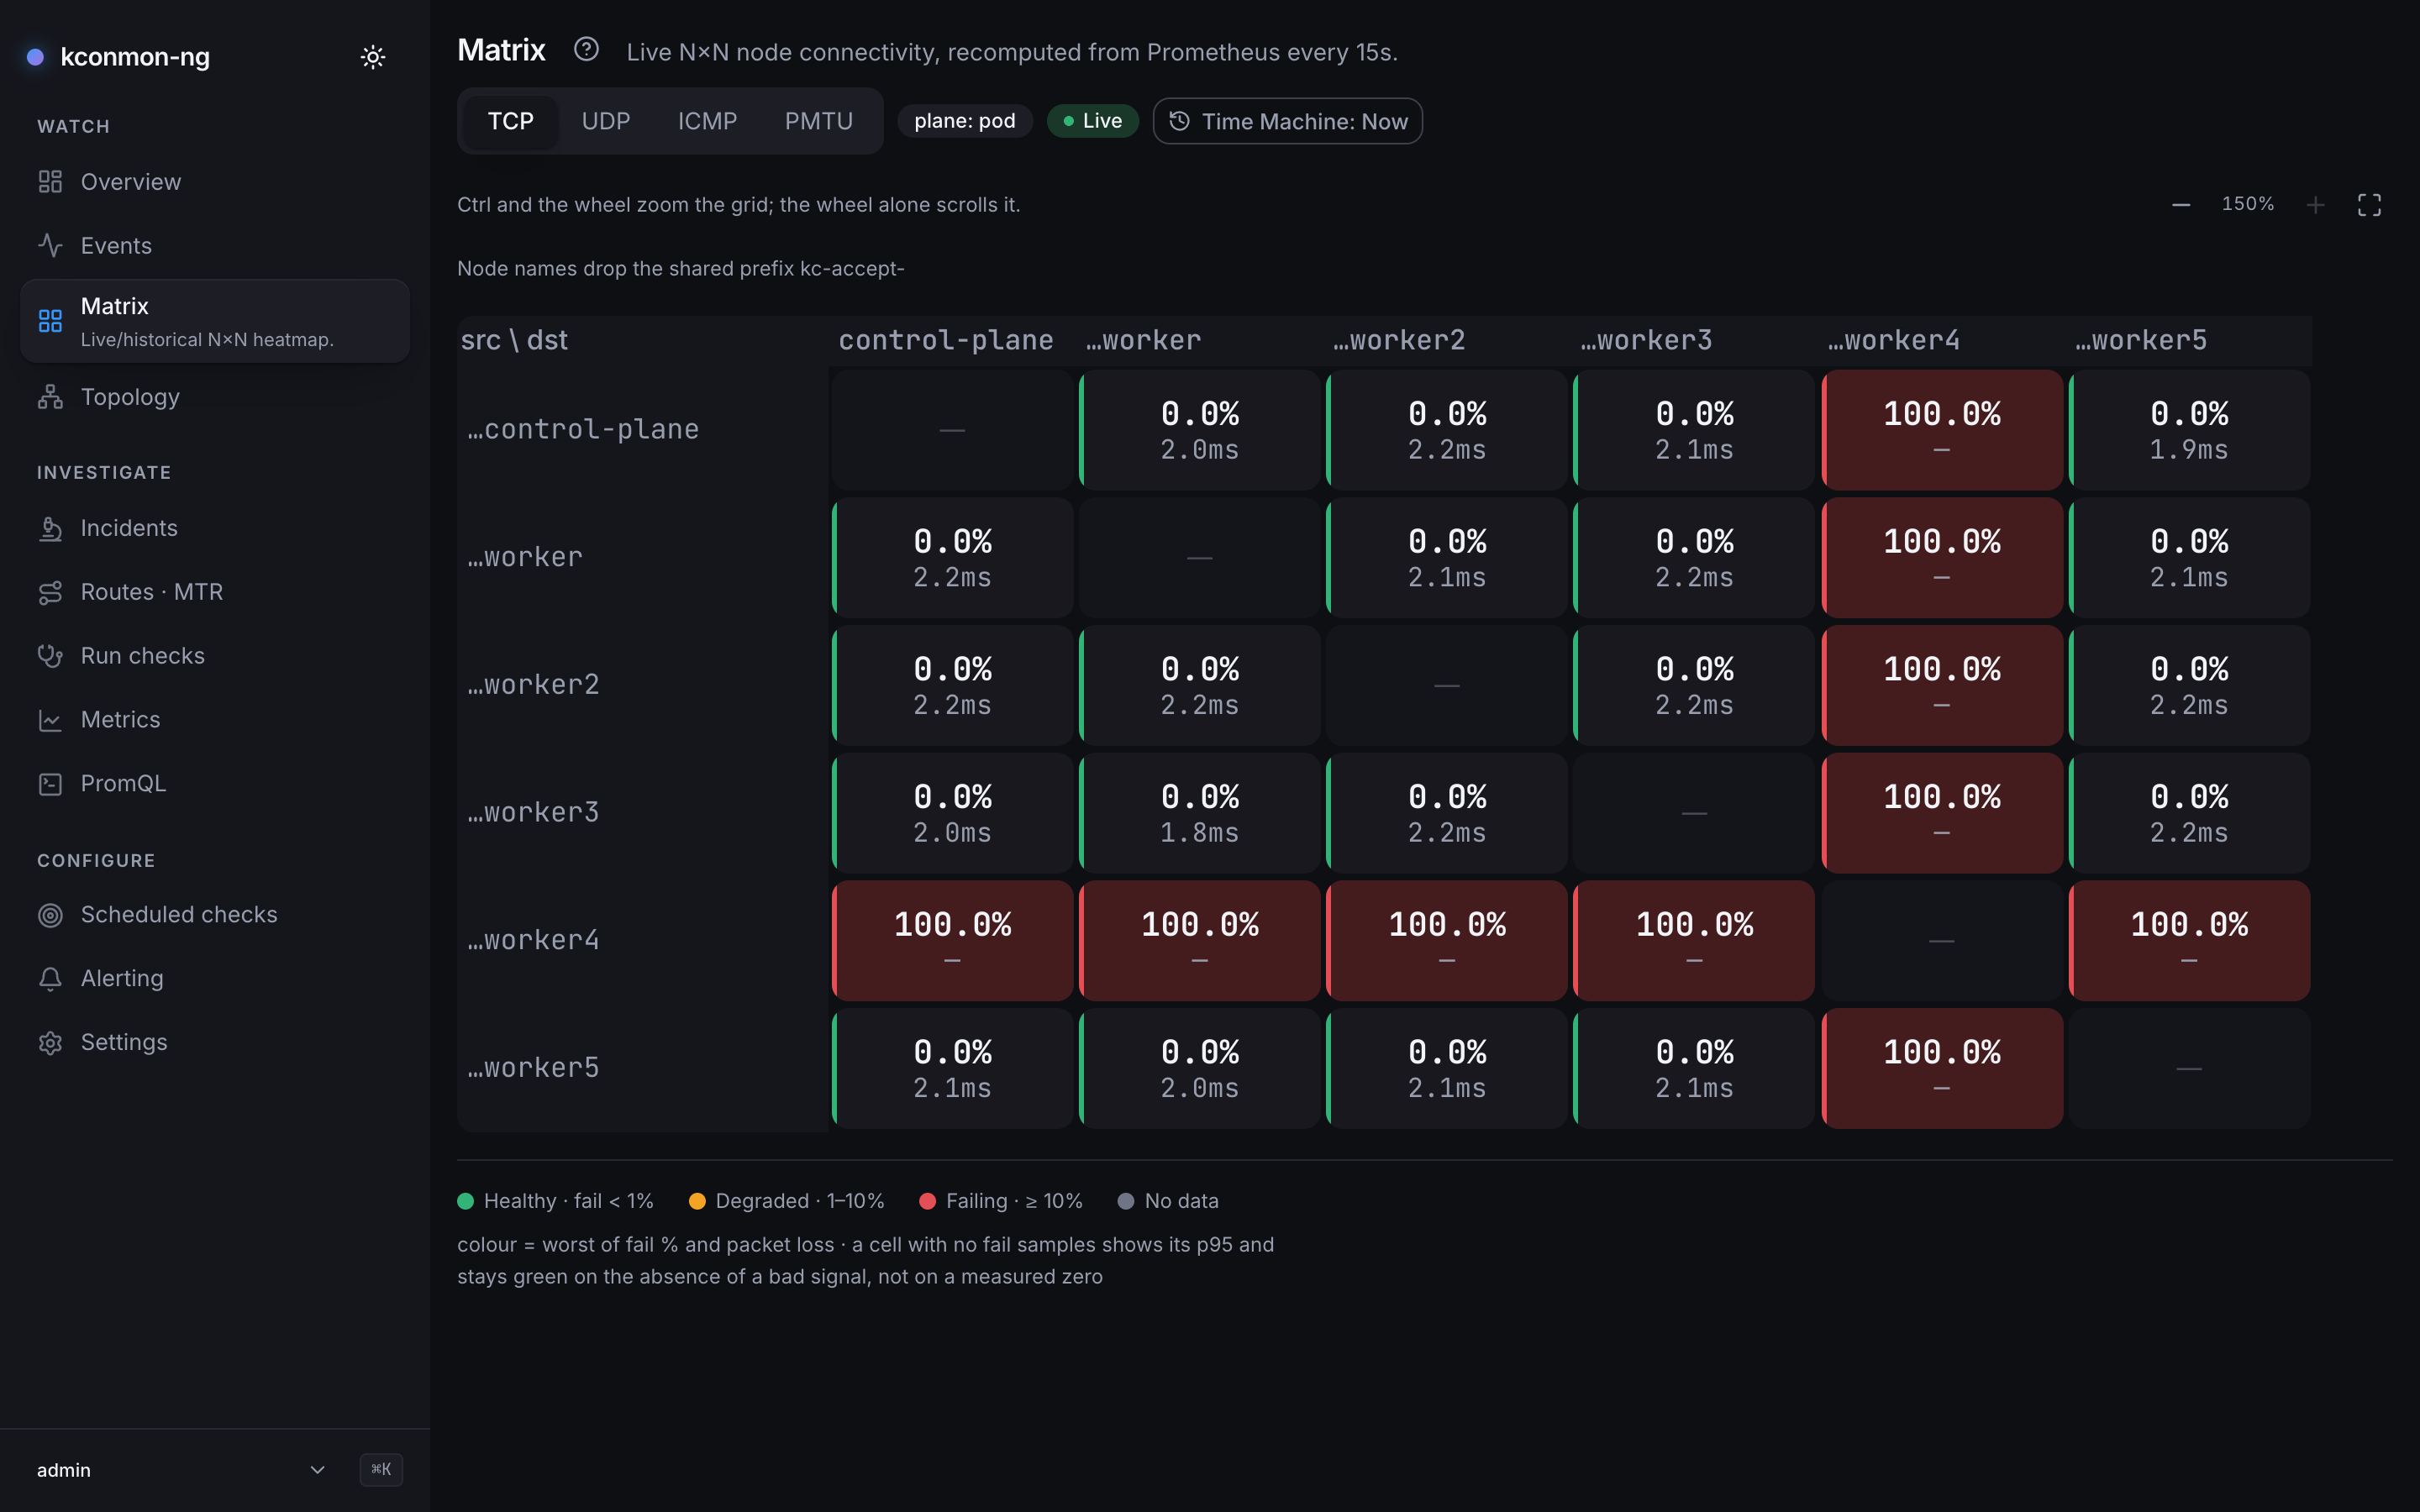
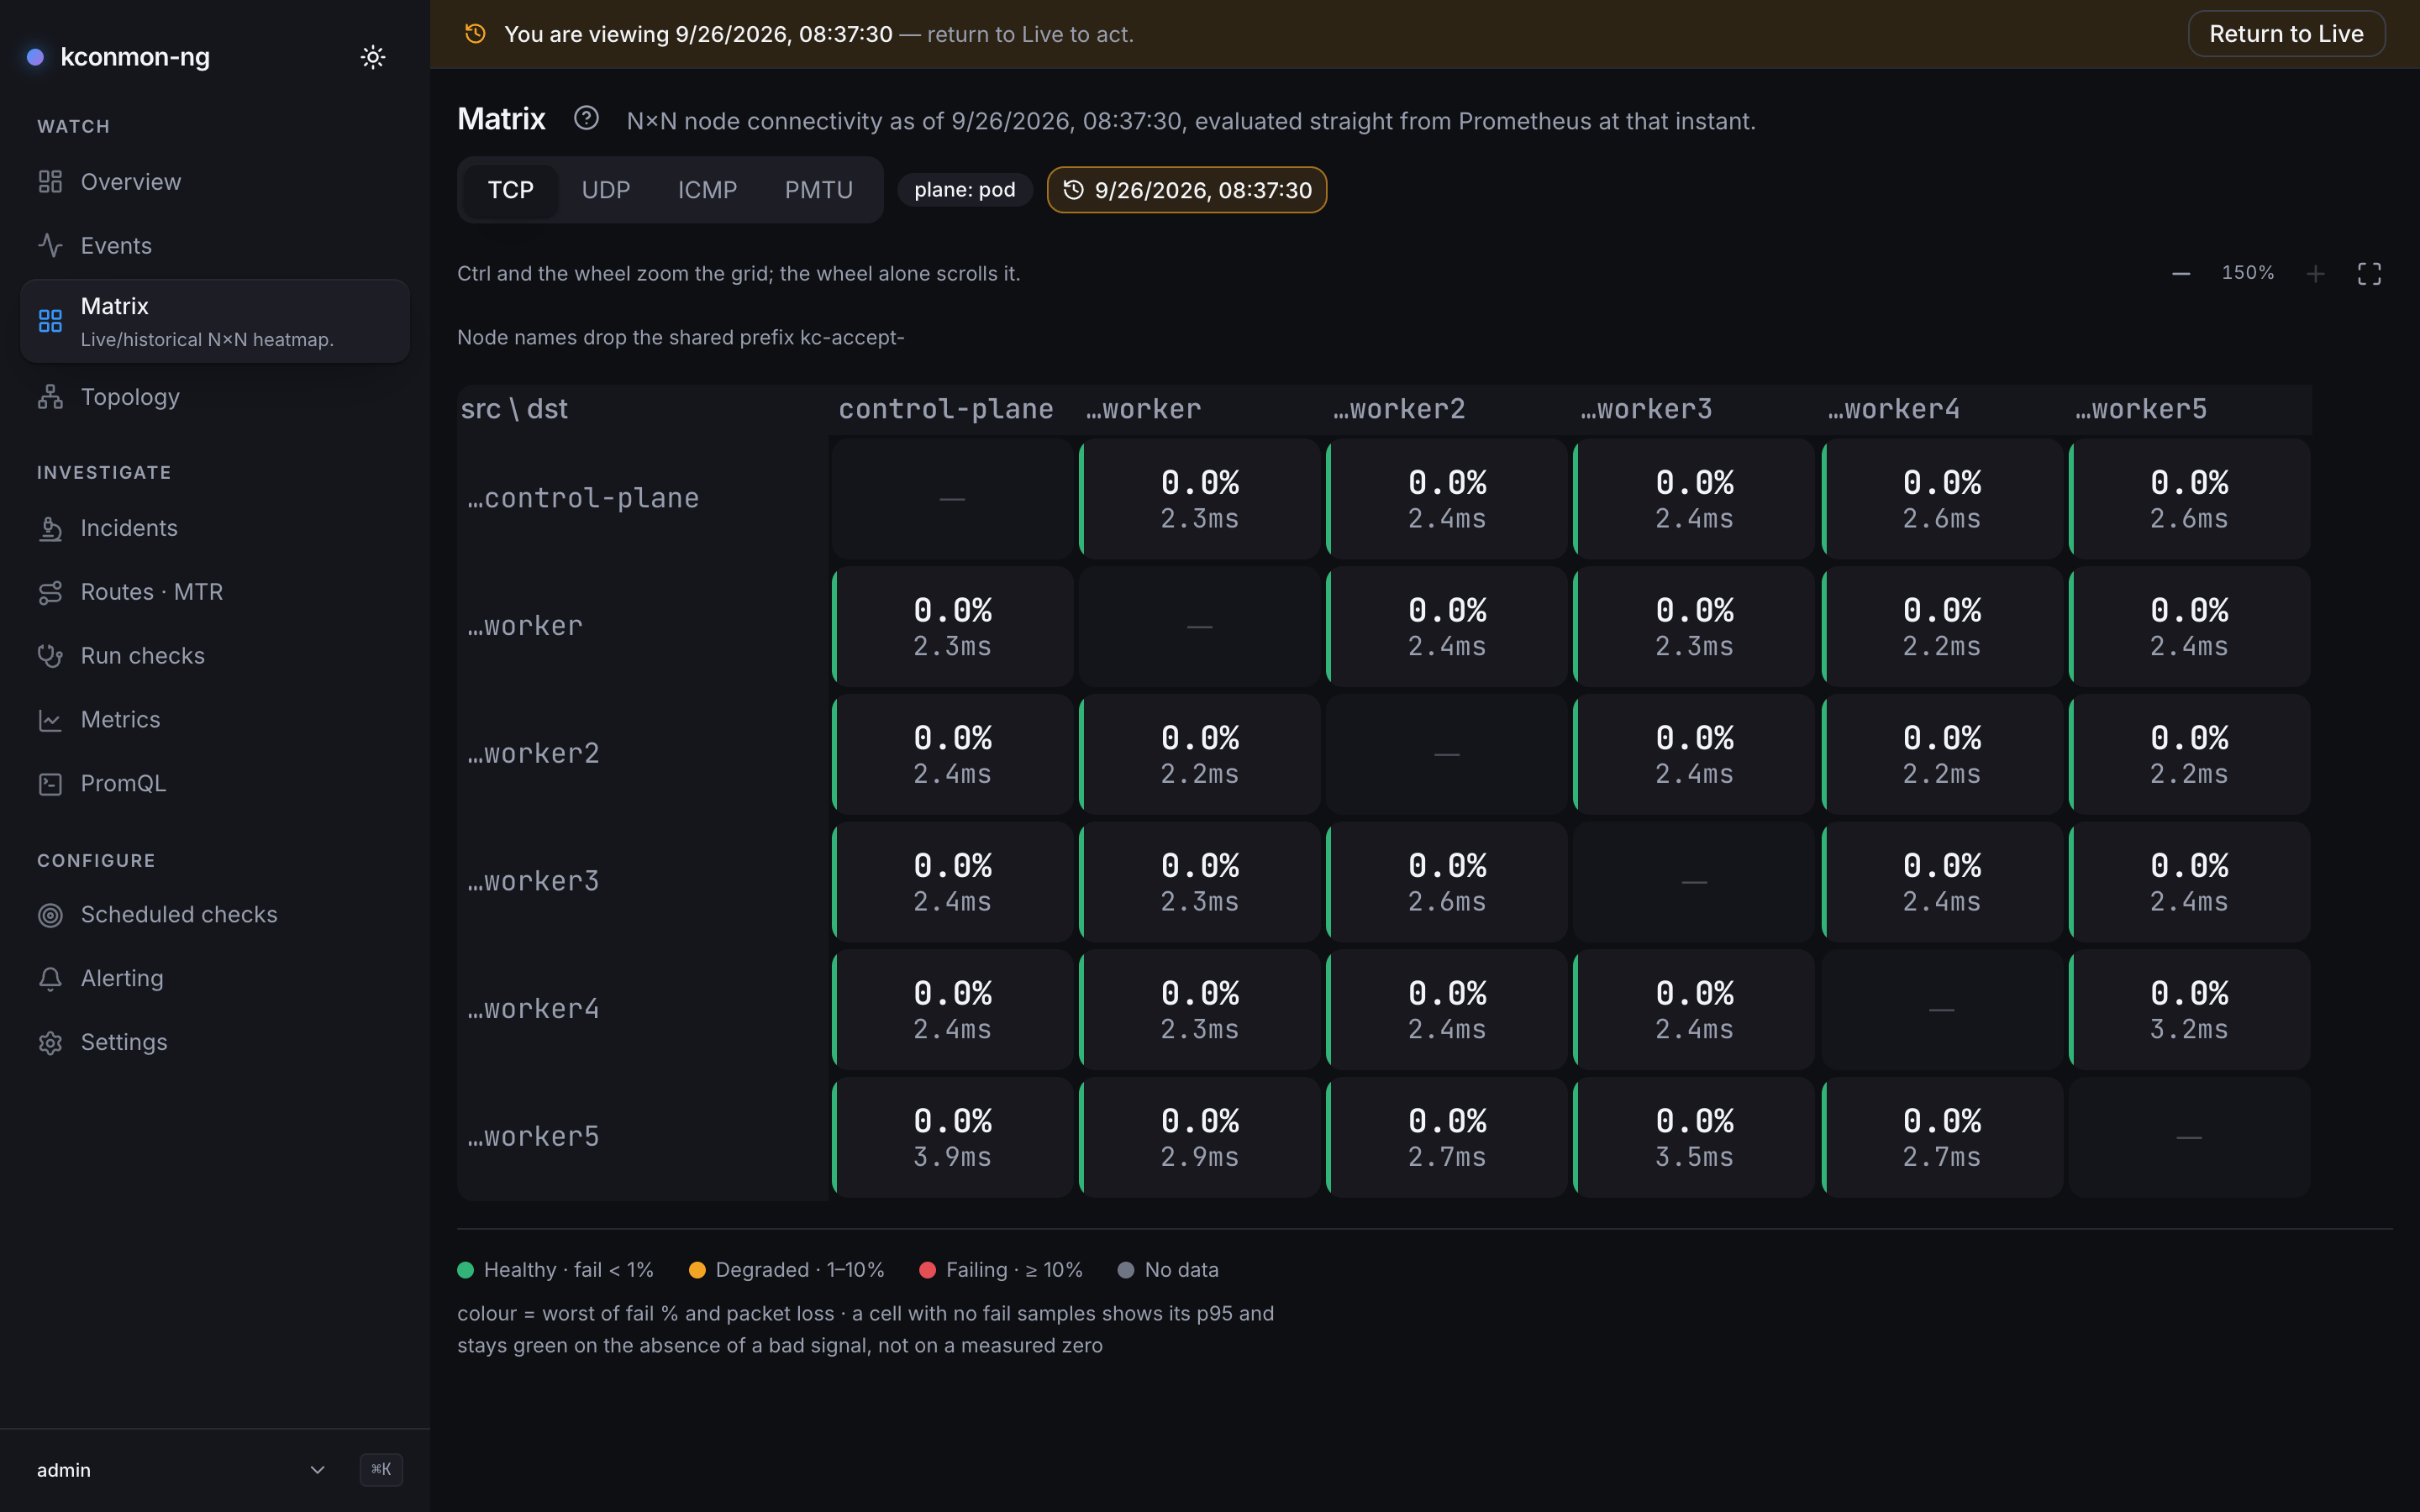
?at= to 9/26/2026 08:37:30, about a minute and a half before the break in the frame above: the amber banner and time control mark the viewed instant, and every one of the 30 pairs is green, worker4 included.Where to go
-
From
helm installto first metrics, then enable the console and catch a breakage on a test cluster. -
Agent, controller and console; the probe mesh and zones; checks vs runs vs schedules.
-
One page per screen, from the Matrix to the Time Machine.
-
Task-oriented walkthroughs: diagnose a slow pair, set up alerting, probe external targets, wire up OIDC.
-
Since v2.3.0 the same agent runs on a host outside the cluster: deb or rpm on the host, a TLS gateway on the controller, a bearer token and optional client-certificate pinning. The trust model and what v1 does not do are stated up front.
-
Helm values, configuration file, HTTP API, Console API, and the full metrics and alerting reference.
-
The questions that come up: privileges, controller outages, scale limits, what is safe to expose.
-
Source on GitHub; the chart on Artifact Hub and as
oci://ghcr.io/esdmitrii/charts/kconmon-ng; imagesghcr.io/esdmitrii/kconmon-ng-{agent,controller,console}on GHCR; the release notes.