Pair, node and target pages
The object pages. None of them is in the sidebar; you reach one by clicking the object anywhere in the console. Three of a kind (the pair page, the node page, the target card), each built the same way: an identity header with a health verdict, tabs over the object's own data, and a right rail of related incidents and recent changes. The Open incidents card asks for incidents only once the console knows who you are; if /api/v1/auth/me failed, it says "Could not check access to incidents, so none were requested" and asks for a reload instead of loading forever. If the console configuration cannot be read (GET /api/v1/config failed), the card and the Recent changes rail say so with the server's detail, rather than asking for a database. Under the Time Machine the card lists the incidents that were open at the viewed instant (declared by then and not yet resolved), shows "at {instant}" under its title, and when there are none says "No incident open at that instant names this object." To find them it scans the incident list newest first and stops after 50 pages; when it stops before the list ends, the card says so: "The scan stopped at its page limit, so an older incident open at this instant may be missing." The fourth object page, the run permalink, is covered with Run checks. All of them honour the Time Machine, and none carries the "?" help button; their orientation lives on the pages that link to them.
The pair page
/pairs/<source>/<destination>: one directed pair. The header shows both directed legs as badges, and each badge is a matrix cell's reading: the failure percentage, or no data for a pair nothing probed, or no fail data for a silent failure counter next to a live p95. That is the matrix's own two-readings rule, in the same words.
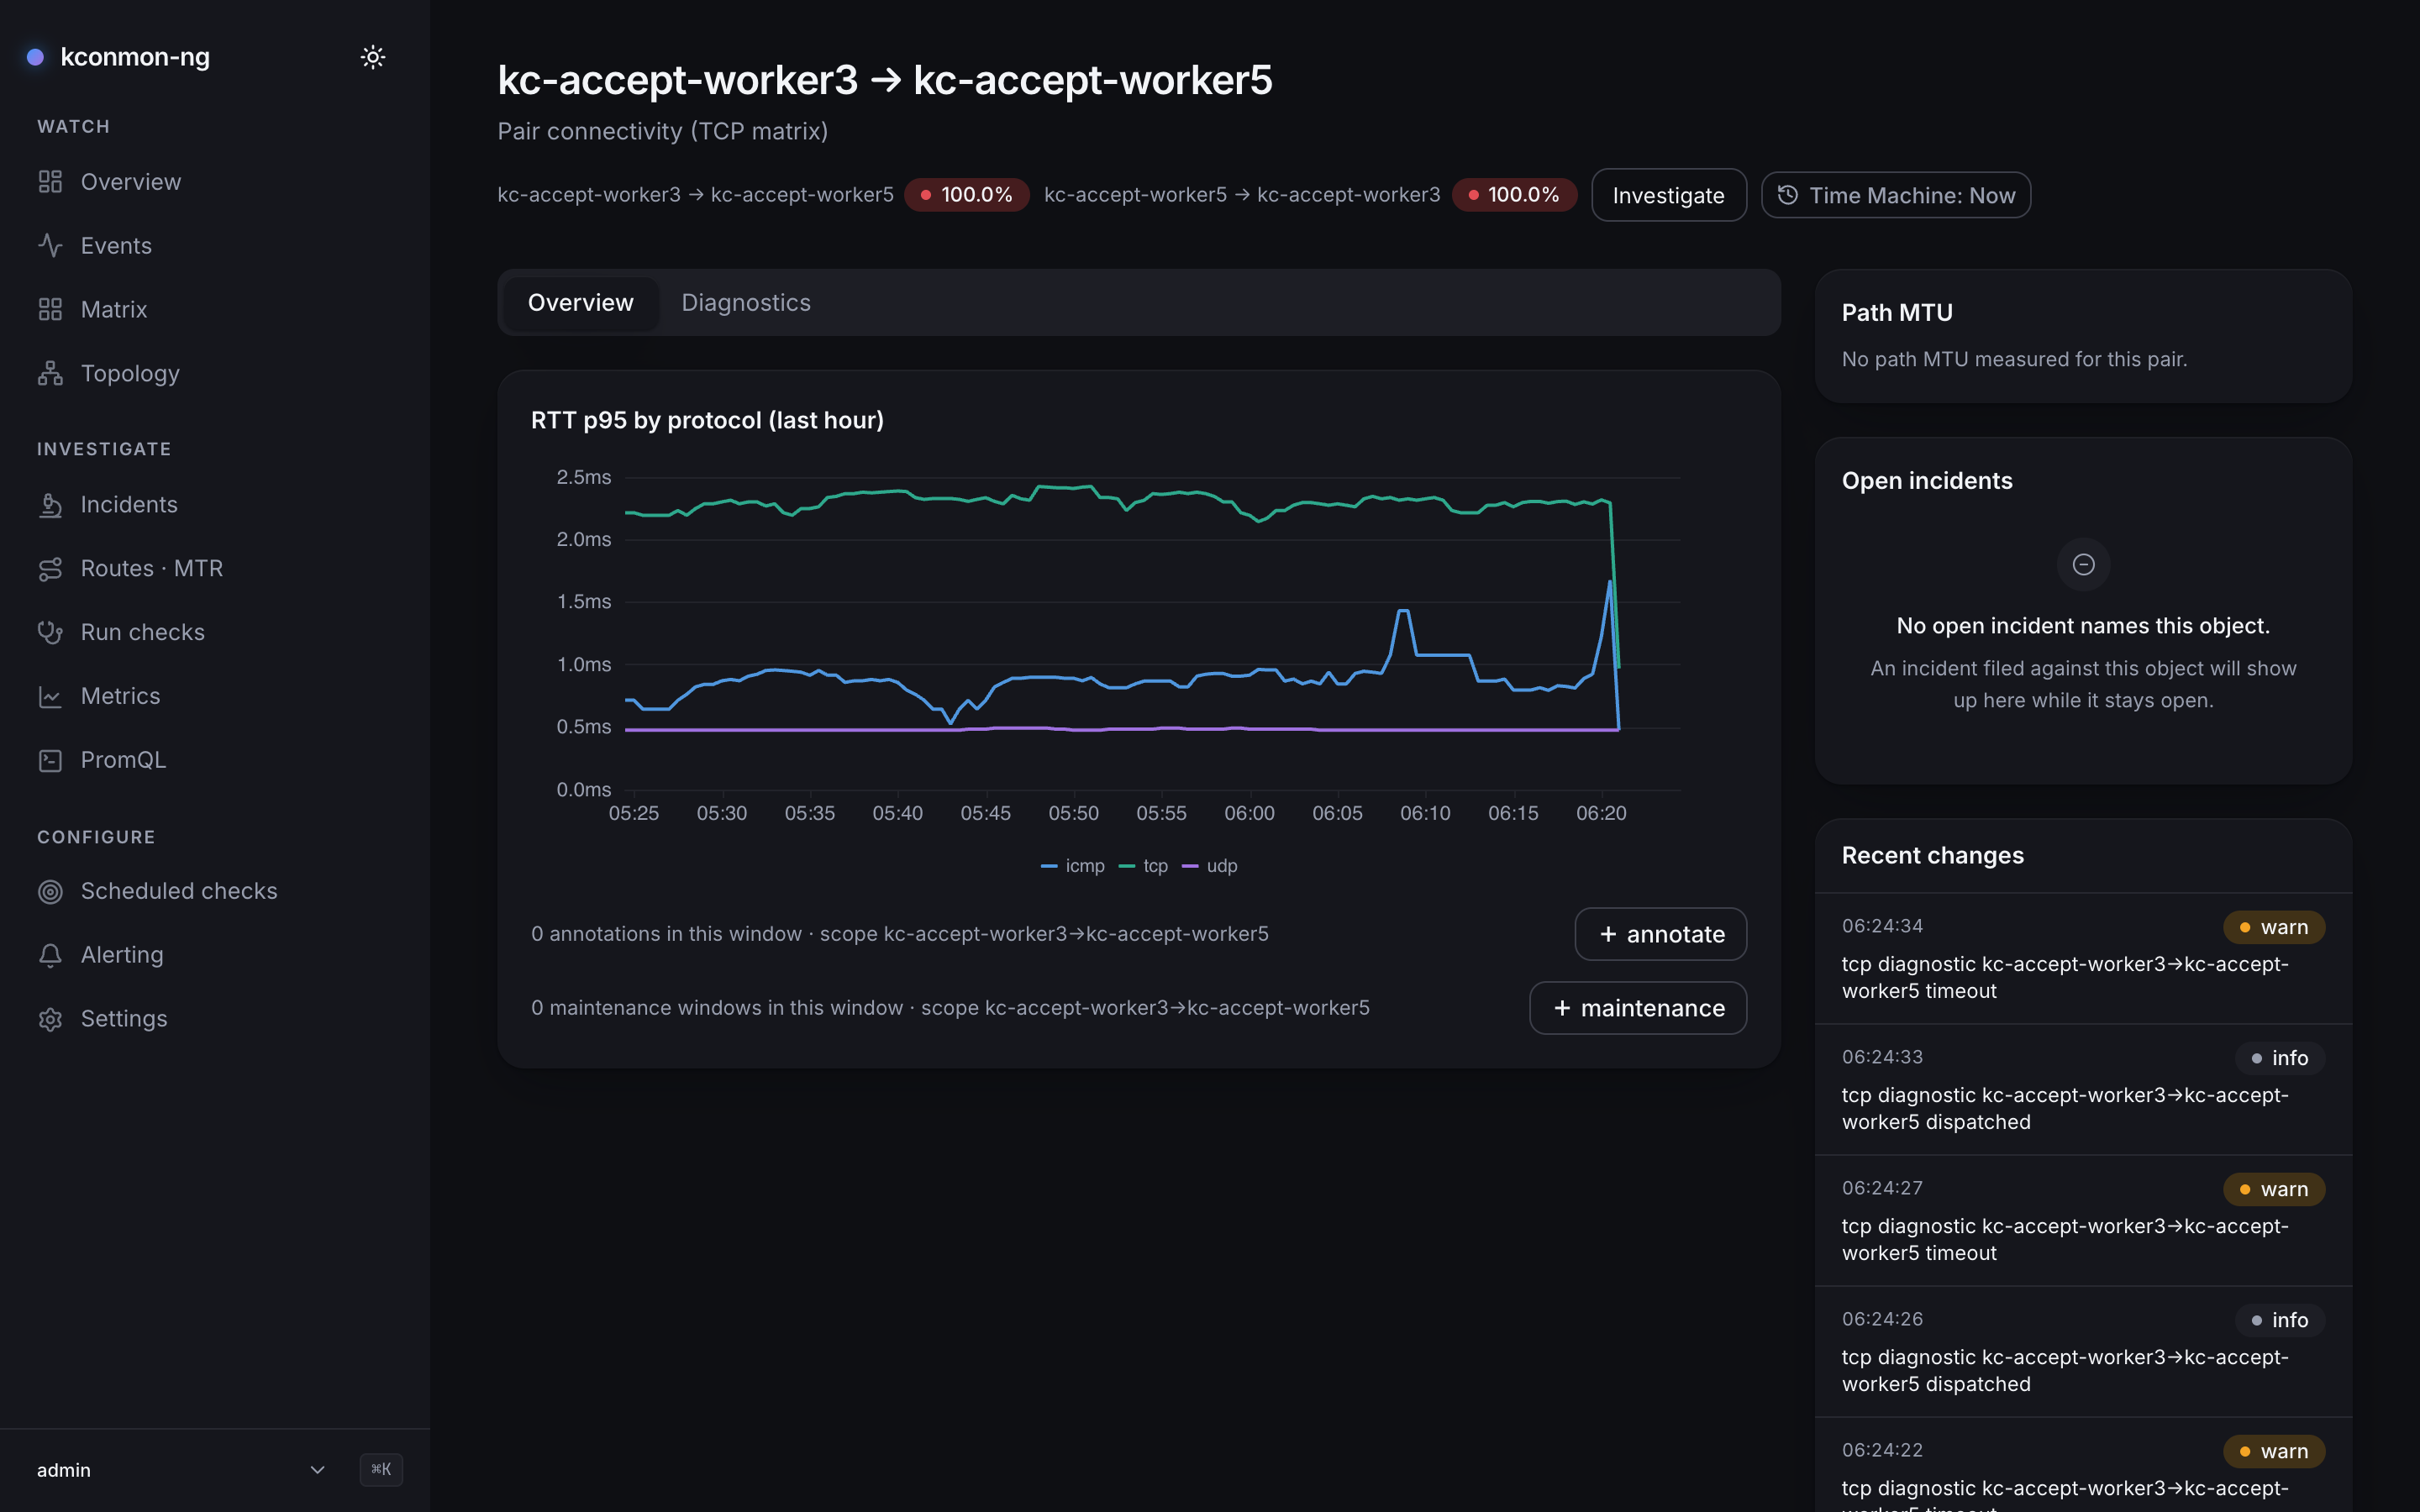
The header badges read from the TCP matrix, and the card says so ("Pair connectivity (TCP matrix)"). The chart below is per-protocol, so the two can disagree: the badge is a matrix cell and the matrix a badge summarises is one protocol's; the chart is a Prometheus query and asks all three. For a per-protocol verdict on this traffic, use the protocol switch on the node page or on Matrix.
Two tabs:
Overview holds the RTT p95 by protocol chart: one PromQL query pulling the pair's TCP, UDP and ICMP p95 series over the last hour, or the hour ending at the viewed instant. Under it ride the pair's annotation and maintenance bars, scoped to the pair over the same hour. Literally the same resolved window as the chart, anchored once, so the bars cannot drift against what is plotted.
Diagnostics holds Last run for this pair, with the whole run id and a one-line Recorded stamp, and a Run check button (needs runs:create), which starts a TCP run for exactly this source and destination and jumps to its permalink; while the Time Machine is engaged the button is disabled, since a probe started from a view of the past would run now, against the present fleet. The last-run lookup is a client-side scan: GET /api/v1/runs has no source/destination filter yet, so the page fetches the 20 most recent runs' details and searches them. The bound is kept small because each candidate costs one extra GET /api/v1/runs/{id}, an older matching run may exist without showing here, and the page states both facts. Engaged, the scan also cuts to runs started at or before the viewed instant.
Path MTU tops the right rail, above the related incidents and Recent changes. The header badges are the TCP plane, and a black hole passes every TCP probe, so without this card a pair opened from a red PMTU cell would read healthy. It reads the PMTU matrix in both directions, one row per direction that has a reading: the size in bytes ("1500 bytes", or "1400 of 1500 bytes" on a reduced path or a black hole) and a badge, Full size, Reduced, Recovering or Black hole, coloured the way the matrix colours the cell. While the PMTU matrix loads the card shows a skeleton, when it cannot be read the card shows the error, and a pair with no reading in either direction says "No path MTU measured for this pair."
A pair whose endpoints the fleet does not report gets a named 404 ("This fleet has no node called “{name}”") with a Back to Matrix link, and it names which half of the URL is the typo; with one unknown name the explanation speaks of that one name, so it never reads as if the valid node had gone too. Two design choices behind it: the known-node inventory generously includes both ends of every matrix cell, because a name Prometheus holds a measurement for is a real node whatever the topology lists, and the check runs only while live, since a historical view's inventory is a reconstruction and cannot support the claim "no such node".
The node page
/nodes/<name>: one node, both directions. The header shows the zone, the tier badge, and "{percent}% healthy". Both read every pair the node is on, into it as well as out of it: a node its peers cannot reach is what NodeUnreachable fires on, and its own outbound pairs can all be green. The tier is the worst pair's matrix tier, so a reduced path MTU reads Degraded here as it does in the grid. The percentage is 100% minus the worst failure ratio or packet loss, and it is left out when the tier rests on something it does not count, such as a path MTU black hole under the 10% line. When only part of the evidence is scored, the figure carries its own denominator ("{scored} of {total} pairs scored") rather than presenting a claim about one ninth of the node as a claim about the node.
A link to a node the fleet does not report gets a not-found card titled No such node ("This fleet has no node called “{name}”", Back to Matrix) rather than an empty node with annotate and maintenance buttons. Its body says why: a node card shows only a node the fleet reports, so the name may be a typo or the node may have left the fleet since the link was made. As on the pair page, the check runs only while live and once the node inventory has answered.
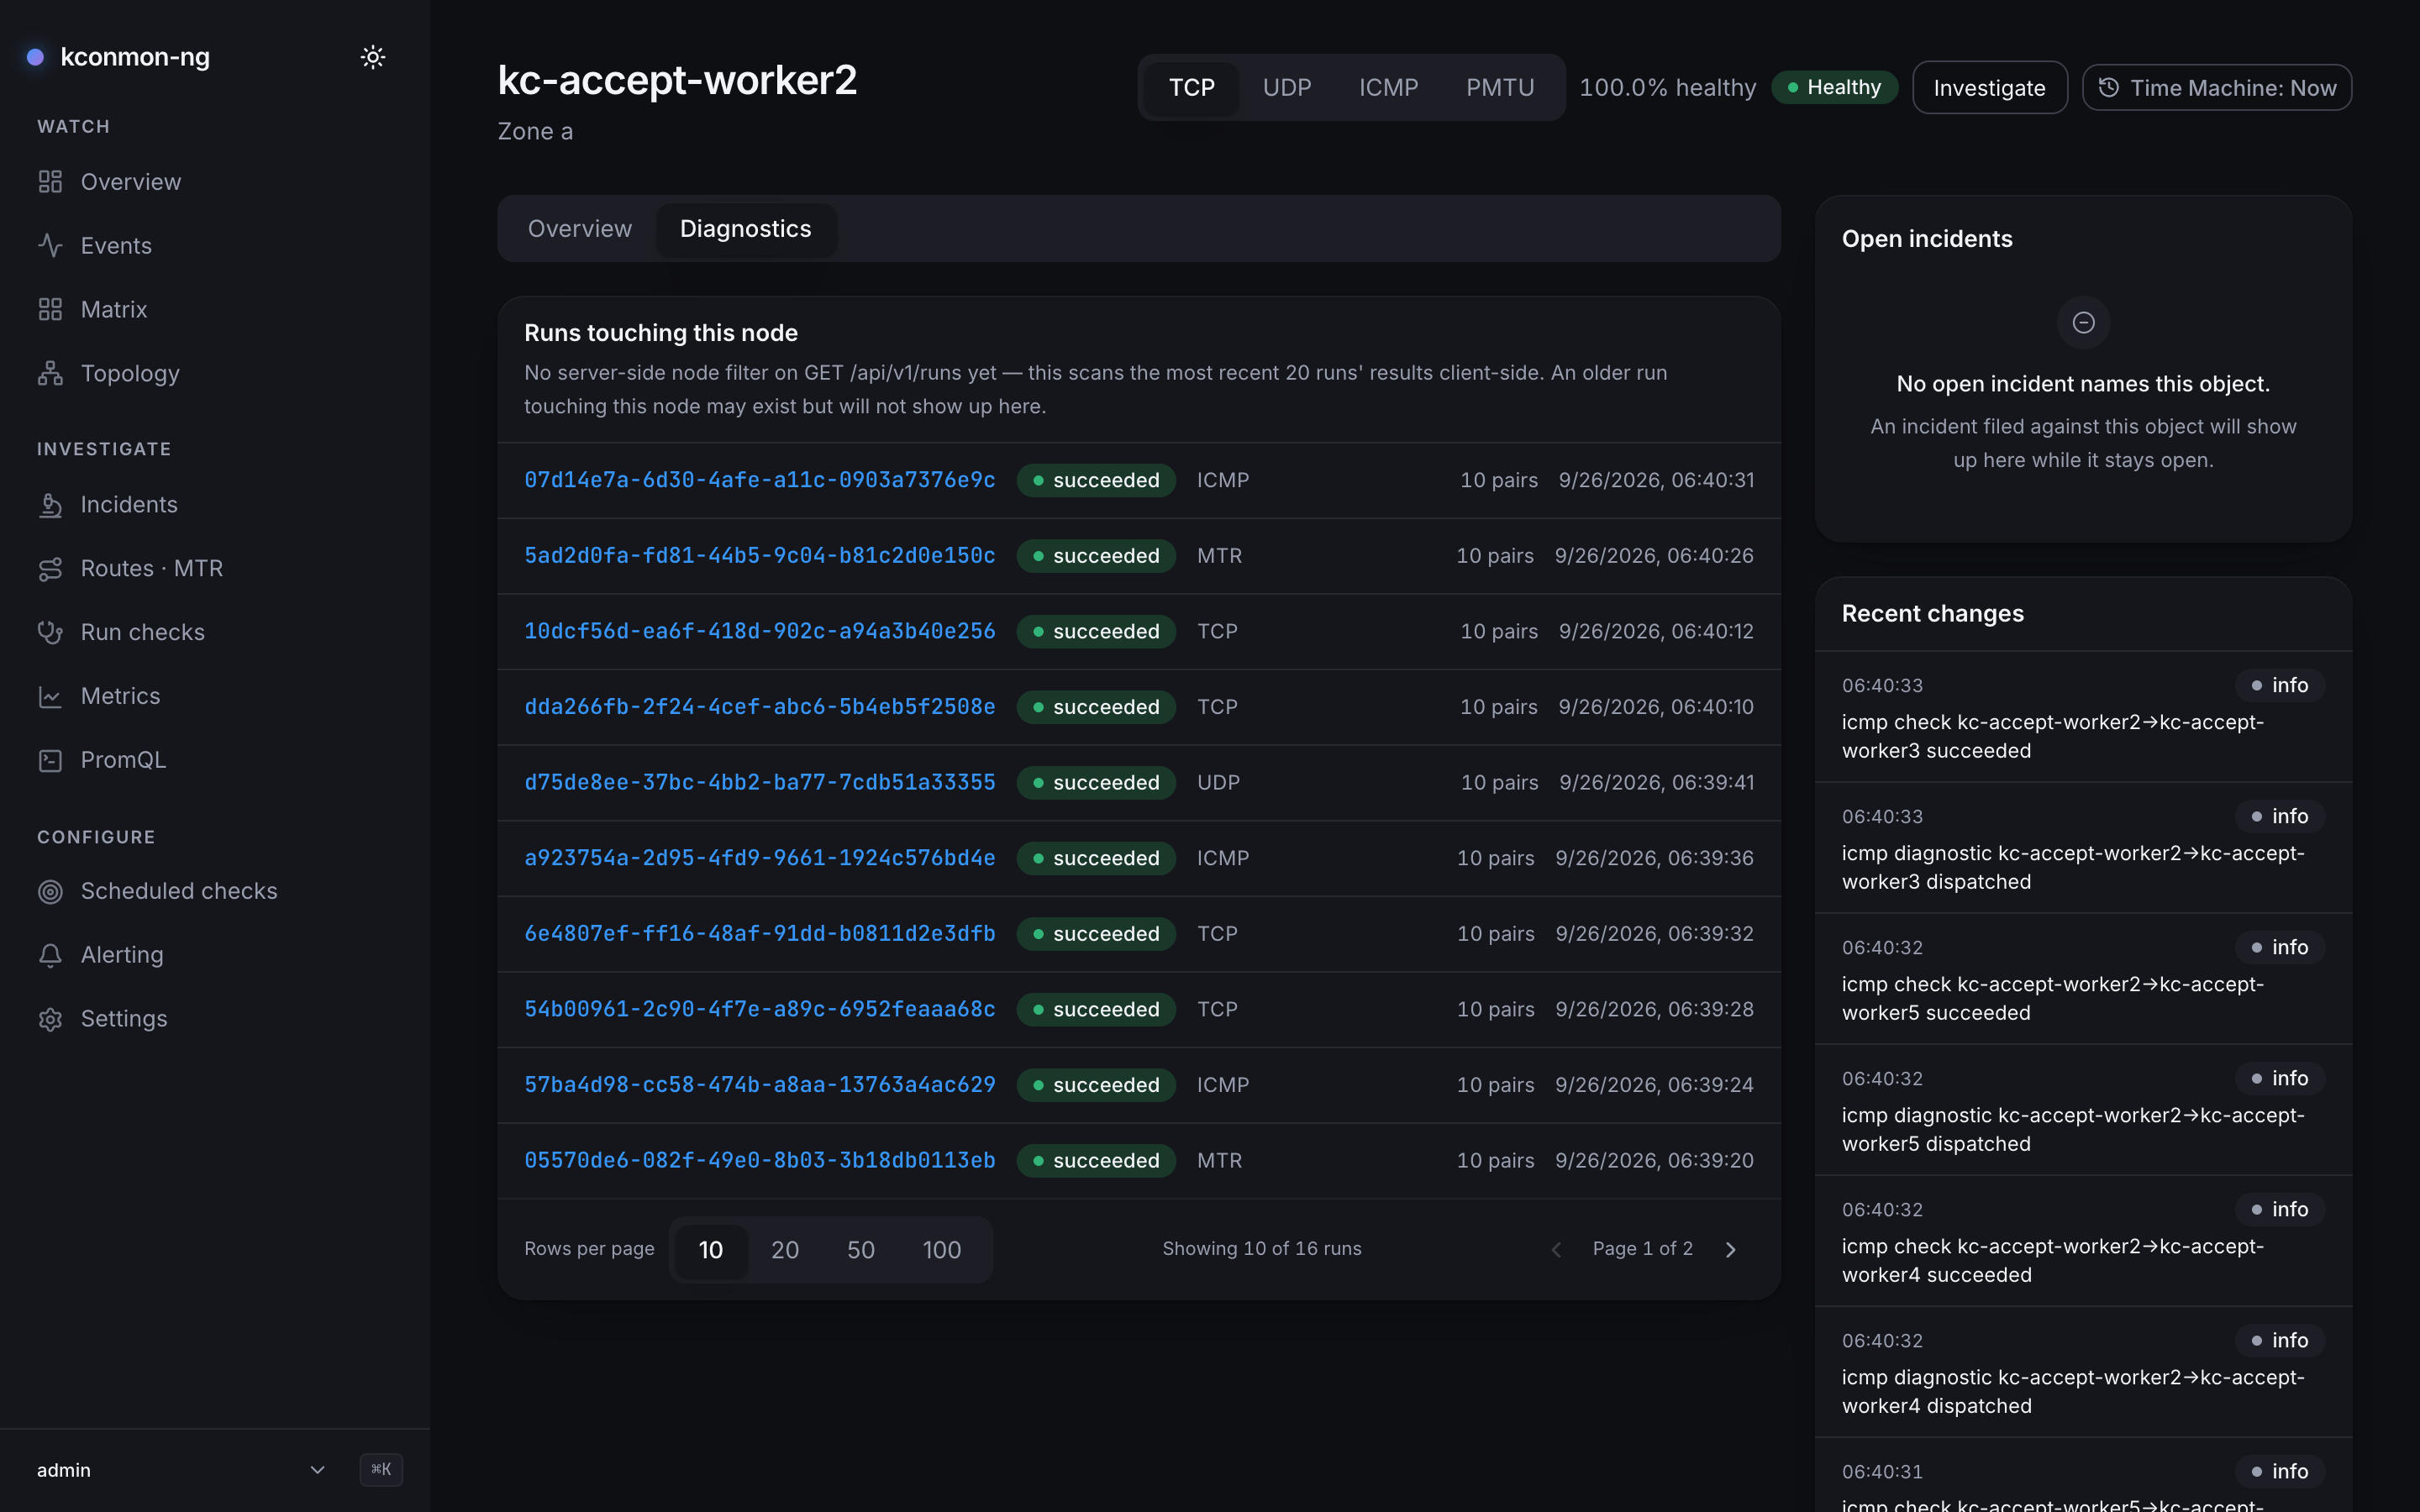
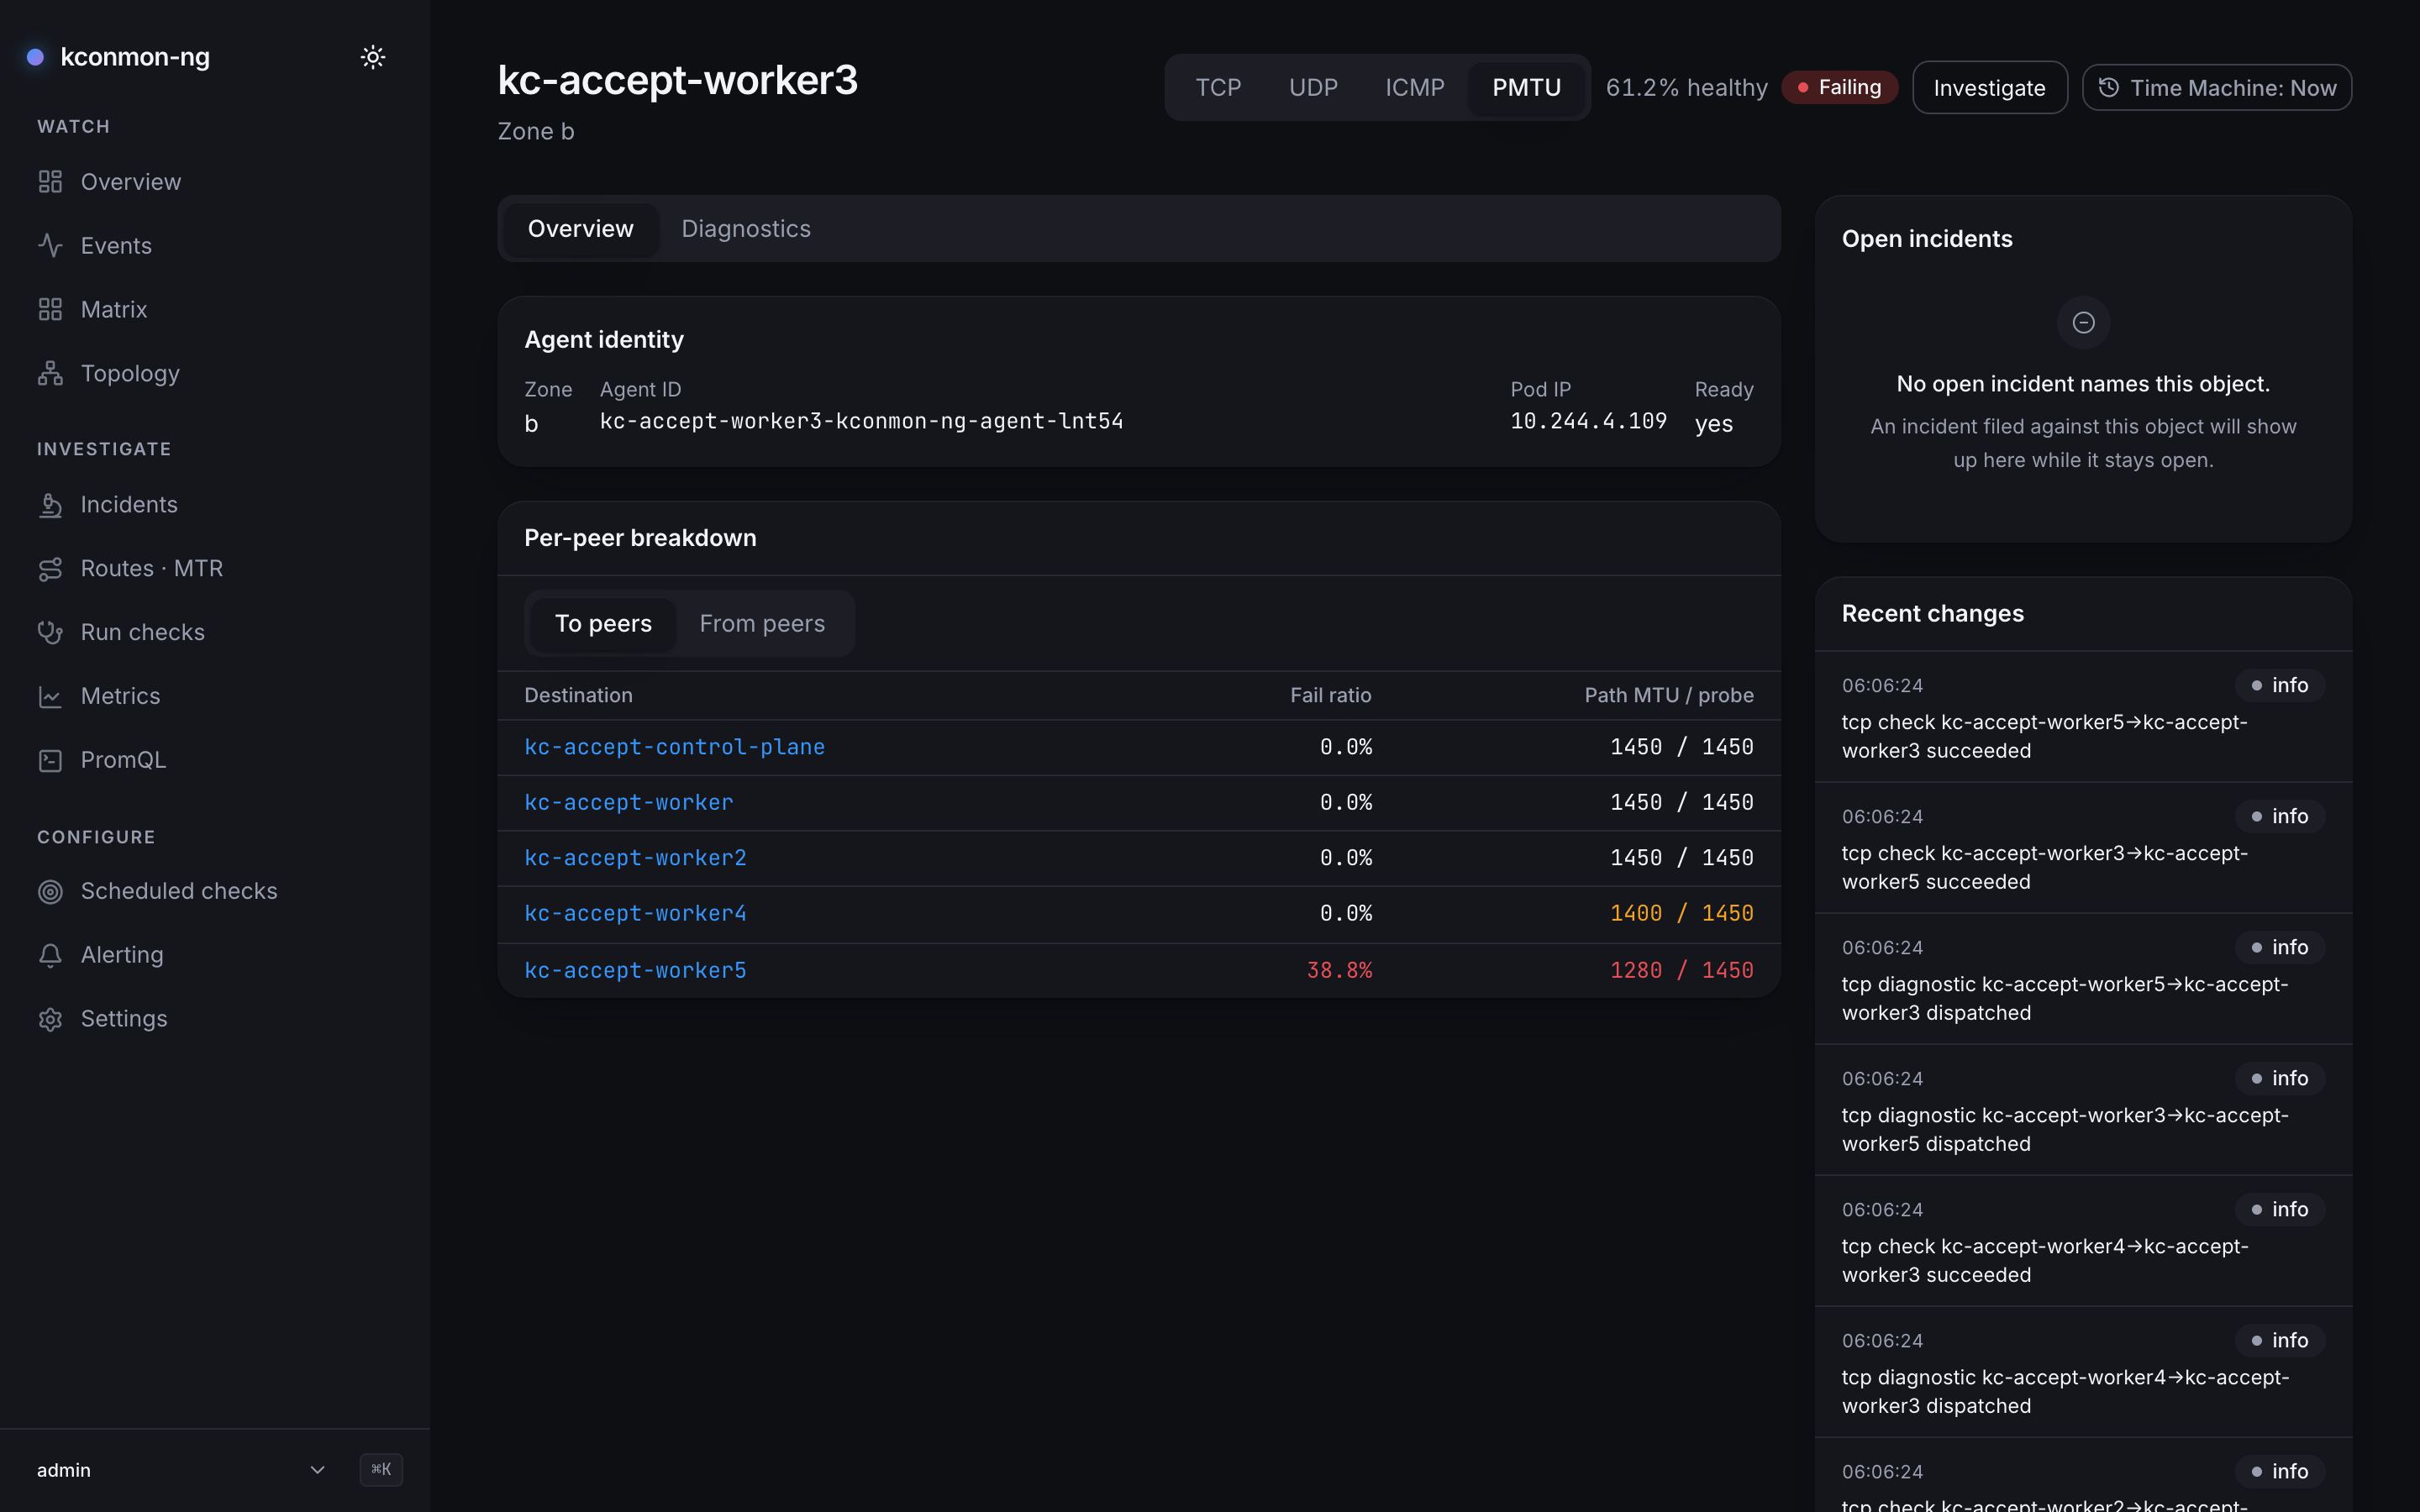
kc-accept-worker2: the protocol switch in the header, and the 20-run scan with its disclosed bound. Each row counts the run's pairs on either side of this node, 10 of the 30 an all-nodes run covers.The header also carries a protocol switch (TCP / UDP / ICMP / PMTU). It changes which matrix the whole card reads: the header's tier and health percentage, and the per-peer table below. The choice is written to ?protocol=, the same URL key Matrix uses, so the view is shareable and the two surfaces cannot spell it differently. On UDP and ICMP the verdict is worst-of failure ratio and packet loss, and the breakdown table grows a Packet loss column whenever the cells carry loss: the vector that can decide the tier is the vector that gets a column. On PMTU the table grows a Path MTU / probe column instead (the size that crossed over the size the source probes at, amber for a reduced or recovering path, red for a black hole), and the RTT column drops out, since the path MTU probe records no RTT.
Two tabs:
Overview holds the identity card and the breakdown.
- Agent identity: Zone, Agent ID, Pod IP, Ready. Readiness comes from the Kubernetes node informer, and a registered agent is not evidence of it, so on a fleet with no k8s node view the field stays a dash and the hover says why. Zone falls back to what the agent registered with, so that field has an answer either way.
- Per-peer breakdown: a paged table of the node's pairs in one direction, switched between To peers (the node's outgoing pairs, first column Destination) and From peers (the pairs into it, first column Source). It opens on the direction the trouble is in: outbound, unless the inbound pairs are strictly worse, and it follows the trouble on every poll until you pick a direction yourself. Columns: the peer, linking to the pair page; Fail ratio; Packet loss while measured; Path MTU / probe on PMTU; RTT p95. It uses the same no data / no fail data readings as the matrix.
For an external agent (2.4.0) the card changes shape without changing its words for cluster nodes. The header carries a neutral external badge; Pod IP becomes Advertised address, since a bare host has no Pod and what it registered is the address its peers probe; the Ready dash explains itself on hover with "an external host has no Kubernetes node; readiness is not reported"; and a Planes row lists the mesh probes the agent advertised as chips, TCP, UDP, ICMP, PMTU and MTR, with the ones it left out struck through (a strike survives a monochrome screen where a greyed chip would not; a 2.4.x host shows PMTU struck through). DNS and HTTP are not chips: they are checks against targets, not planes between peers. An agent that advertised no planes at all (older than 2.4.0) shows unknown, and the console reads that as every plane rather than none. When Prometheus is not scraping the host, there is no outbound breakdown to page: the card opens on To peers, and the table gives way to an empty state saying that its probe results never reach the console, with a link to Scraping external agents. From peers still lists what the cluster measured toward the host.
Diagnostics holds Runs touching this node: the same 20-run client-side scan as the pair page with the same disclosed bound, listing every run with at least one result on either side of this node.
The right rail holds Related incidents, the Recent changes feed, and Annotations (notes pinned to this node over the last 24 hours plus fleet-wide ones, with the maintenance bar beside them so a node under a declared window does not read as simply broken).
What feeds Recent changes. The rail merges two halves. History is the newest 50 events for this object from GET /api/v1/events, which needs the database; without one the rail says history requires it and keeps working off the socket. Live events arrive over the WebSocket and are matched client-side with the same filter the server applies. The merged ring is capped at 200 rows. The matching matters: probe results and path changes are recorded under pair scopes ("node-a→node-b"), so the node and target rails match their name on either side of a pair scope, not just exact-scope rows. That filter was built for exactly this. Under the Time Machine the rail is bounded to the instant and its header says "up to {at}".
The target card
/targets/<id>: one external target, read-only by design; changing targets happens on Scheduled checks. The header shows the name, kind, address, and a health verdict computed by an instant Prometheus query: the success share of kconmon_ng_external_results_total for this target over 5 minutes. Under the Time Machine that query's evaluation instant moves, which is what "state as of {at}" means for an instant read.
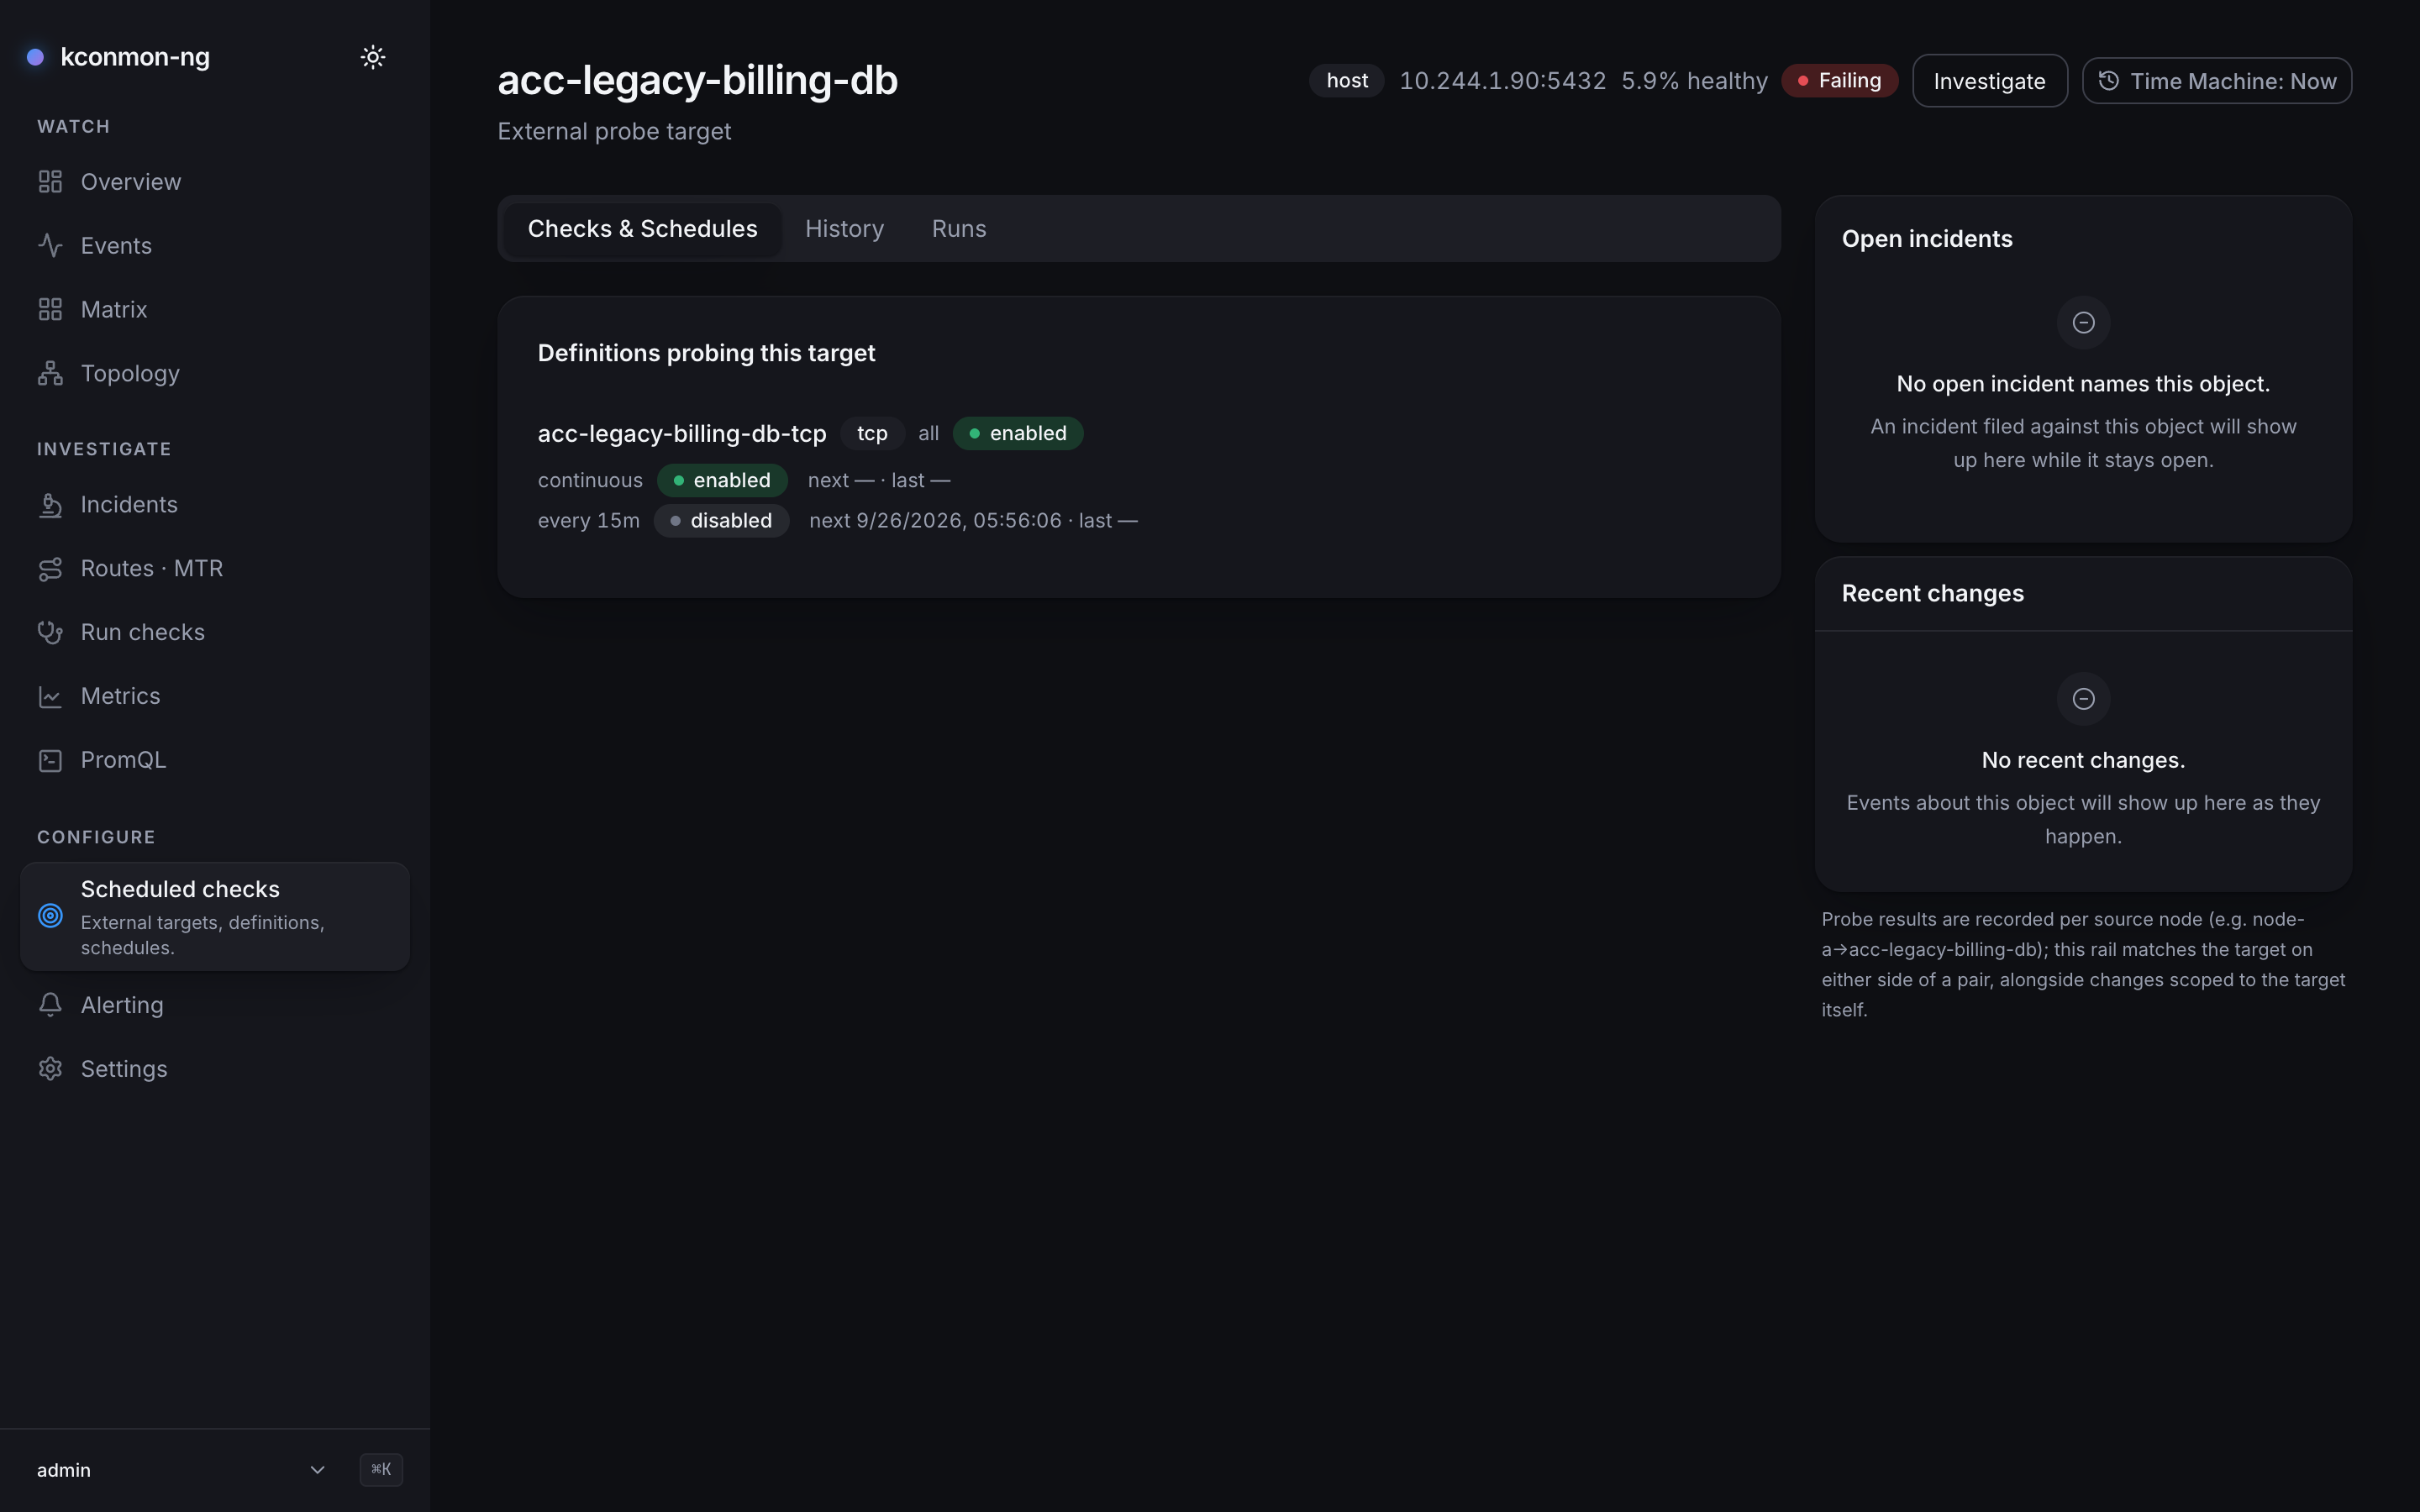
Access is layered, and each layer says what it gates. targets:read (operator and admin; deliberately not viewer, which is the role an anonymous session gets) shows the header. The definitions and schedules below need checks:read; a cadence tells you nothing the definition it belongs to does not, so schedules ride the same permission. The card needs the database outright, since targets are configuration; only the History tab needs Prometheus, and the card says the other tabs do not. When the console cannot read its own configuration (GET /api/v1/config failed), the card says "Could not read the console configuration, so this target was not requested: {error}" instead of asking for a database.
Three tabs:
Checks & Schedules lists the definitions probing this target (GET /api/v1/checks?targetId=, a real server-side filter), each with its check type, source selection, enabled state, and its schedules: cadence, state (including paused: definition disabled), next/last stamps, and any failure message verbatim. A definition with no schedule is flagged in words: "No schedule — this definition only runs when someone starts it by hand." The empty state is equally direct: until a definition points here, nothing probes this target on a schedule. Engaged, a notice states that configuration is shown as of now; only the probe series time-travel.
History draws External probe duration p95 by source node: the last hour (or the hour ending at the viewed instant) of kconmon_ng_external_duration_seconds for this target. Duration is the one external metric every check type populates (RTT and loss exist only for ICMP, HTTP status only for HTTP), so the chart works for a plain TCP target instead of rendering "not measured" as an outage. Its empty state lists all four ways an hour can be blank: external checks are off fleet-wide (checkers.external.enabled), no enabled definition-plus-schedule points here, probing started too recently for a scrape, or every probe failed. That last one is real: the chart is built from durations, and a probe that never completes records none. Annotation and maintenance bars sit under the chart and work even where the chart cannot, since a provider's maintenance on this target does not depend on Prometheus.
Runs lists runs whose spec names this target. Ad-hoc runs against the same address never count: an operator-typed address did not go through the targets table. Same 20-run scan, same disclosed bound.
The rail's Recent changes note explains its own filter: probe results are recorded per source node ("node-a→{target}"), so the rail matches the target on either side of a pair scope, alongside changes scoped to the target itself.
A bad link gets the same named-404 treatment as the pair page, with one addition the card admits to: an unknown id and a malformed one look identical from the client (both answer 404), so the card says the target may have been deleted or the id may be a typo, and offers Back to Scheduled checks.
Getting there
- Matrix: row/column header → node page; any cell → pair page, and the cell's search icon → Incidents for that pair.
- Overview: pair names in Worst pairs → pair page.
- Topology: click a node, or press Enter on it.
- Scheduled checks: a target row opens its card.
- Incidents: timeline rows link back to the objects they name, and every card's header carries an Investigate entry going the other way.