External targets
Goal
Probe destinations that are not fleet peers (the corporate DNS server, a
storage array, a VPN far end, a SaaS endpoint) continuously, from the nodes'
point of view. External checks reuse the same agents and the same metric
pipeline with one deliberate difference of shape: the destination is a
named target (host or url), never a raw address. The name, not the
address, is what every downstream metric and event reports as the
destination, because an address must not become an identifier: readdress the
target and its history stays one series instead of splitting in two.
This is the reverse of external agents
External checks are in-cluster agents probing outward, with no new trust surface. To move the vantage point itself outside the cluster, an agent on a bare host joining the mesh through the controller's TLS gateway, see External agents.
Configure external checks
Nothing is probeable until three layers agree, and each fails visibly when skipped rather than quietly dropping probes.
1. The agent-side gate. Off by default, and the config loader refuses the
half-open state: enabled: true with an empty allowedCidrs is a startup
error ("must be non-empty when enabled... never read as allow-everything"),
not a running agent that denies everything. The process simply does not come
up until the allowlist names something.
config:
  checkers:
    external:
      enabled: true
      allowedCidrs: ["10.20.0.0/16"] # matched against the RESOLVED address
      deniedCidrs: []                # carve-outs; denied wins
networkPolicy:
  externalEgress: # required when networkPolicy.enabled; see below
    - to:
        - ipBlock:
            cidr: 10.20.0.0/16 # no ports: key, so ICMP and MTR pass too
With networkPolicy.enabled=true the chart fails the render if
externalEgress is empty while the external checker is on: the only default
it could write is allow-everything, and it will not do that silently. Keep
the egress rule scoped to the same range as allowedCidrs: one layer lets
the agent try, the other lets the packet leave.
2. Targets and checks, in the Console. Both live on the Scheduled checks page, which is three tabs over three object kinds. The path is target → definition → schedule:
- Targets tab → New target: a Name, a Kind (
host/url), the Address, optional labels. Each target gets its own card at/targets/<id>with probe history. - Definitions tab → New definition: Check type, Source selection
(
all/per-zone/one-per-zone; one vantage point per zone is usually enough and N× cheaper), Destination kindtarget, and Params as JSON. Parameters are per check type:dnsneedsparams.query(the name to resolve),httpneeds a target of kindurl. A definition no agent could run as written (http against ahosttarget, dns with no query) is refused at save time with422, not accepted and silently skipped later. Adnscheck asks the target itself: the agent sends the A and AAAA queries to that address (over TCP again when the answer is truncated) and never answers from/etc/hostsorhostAliases, so a resolver that is down reads red even for a name pinned there. - Schedules tab → New schedule: pick the definition, kind
continuous.
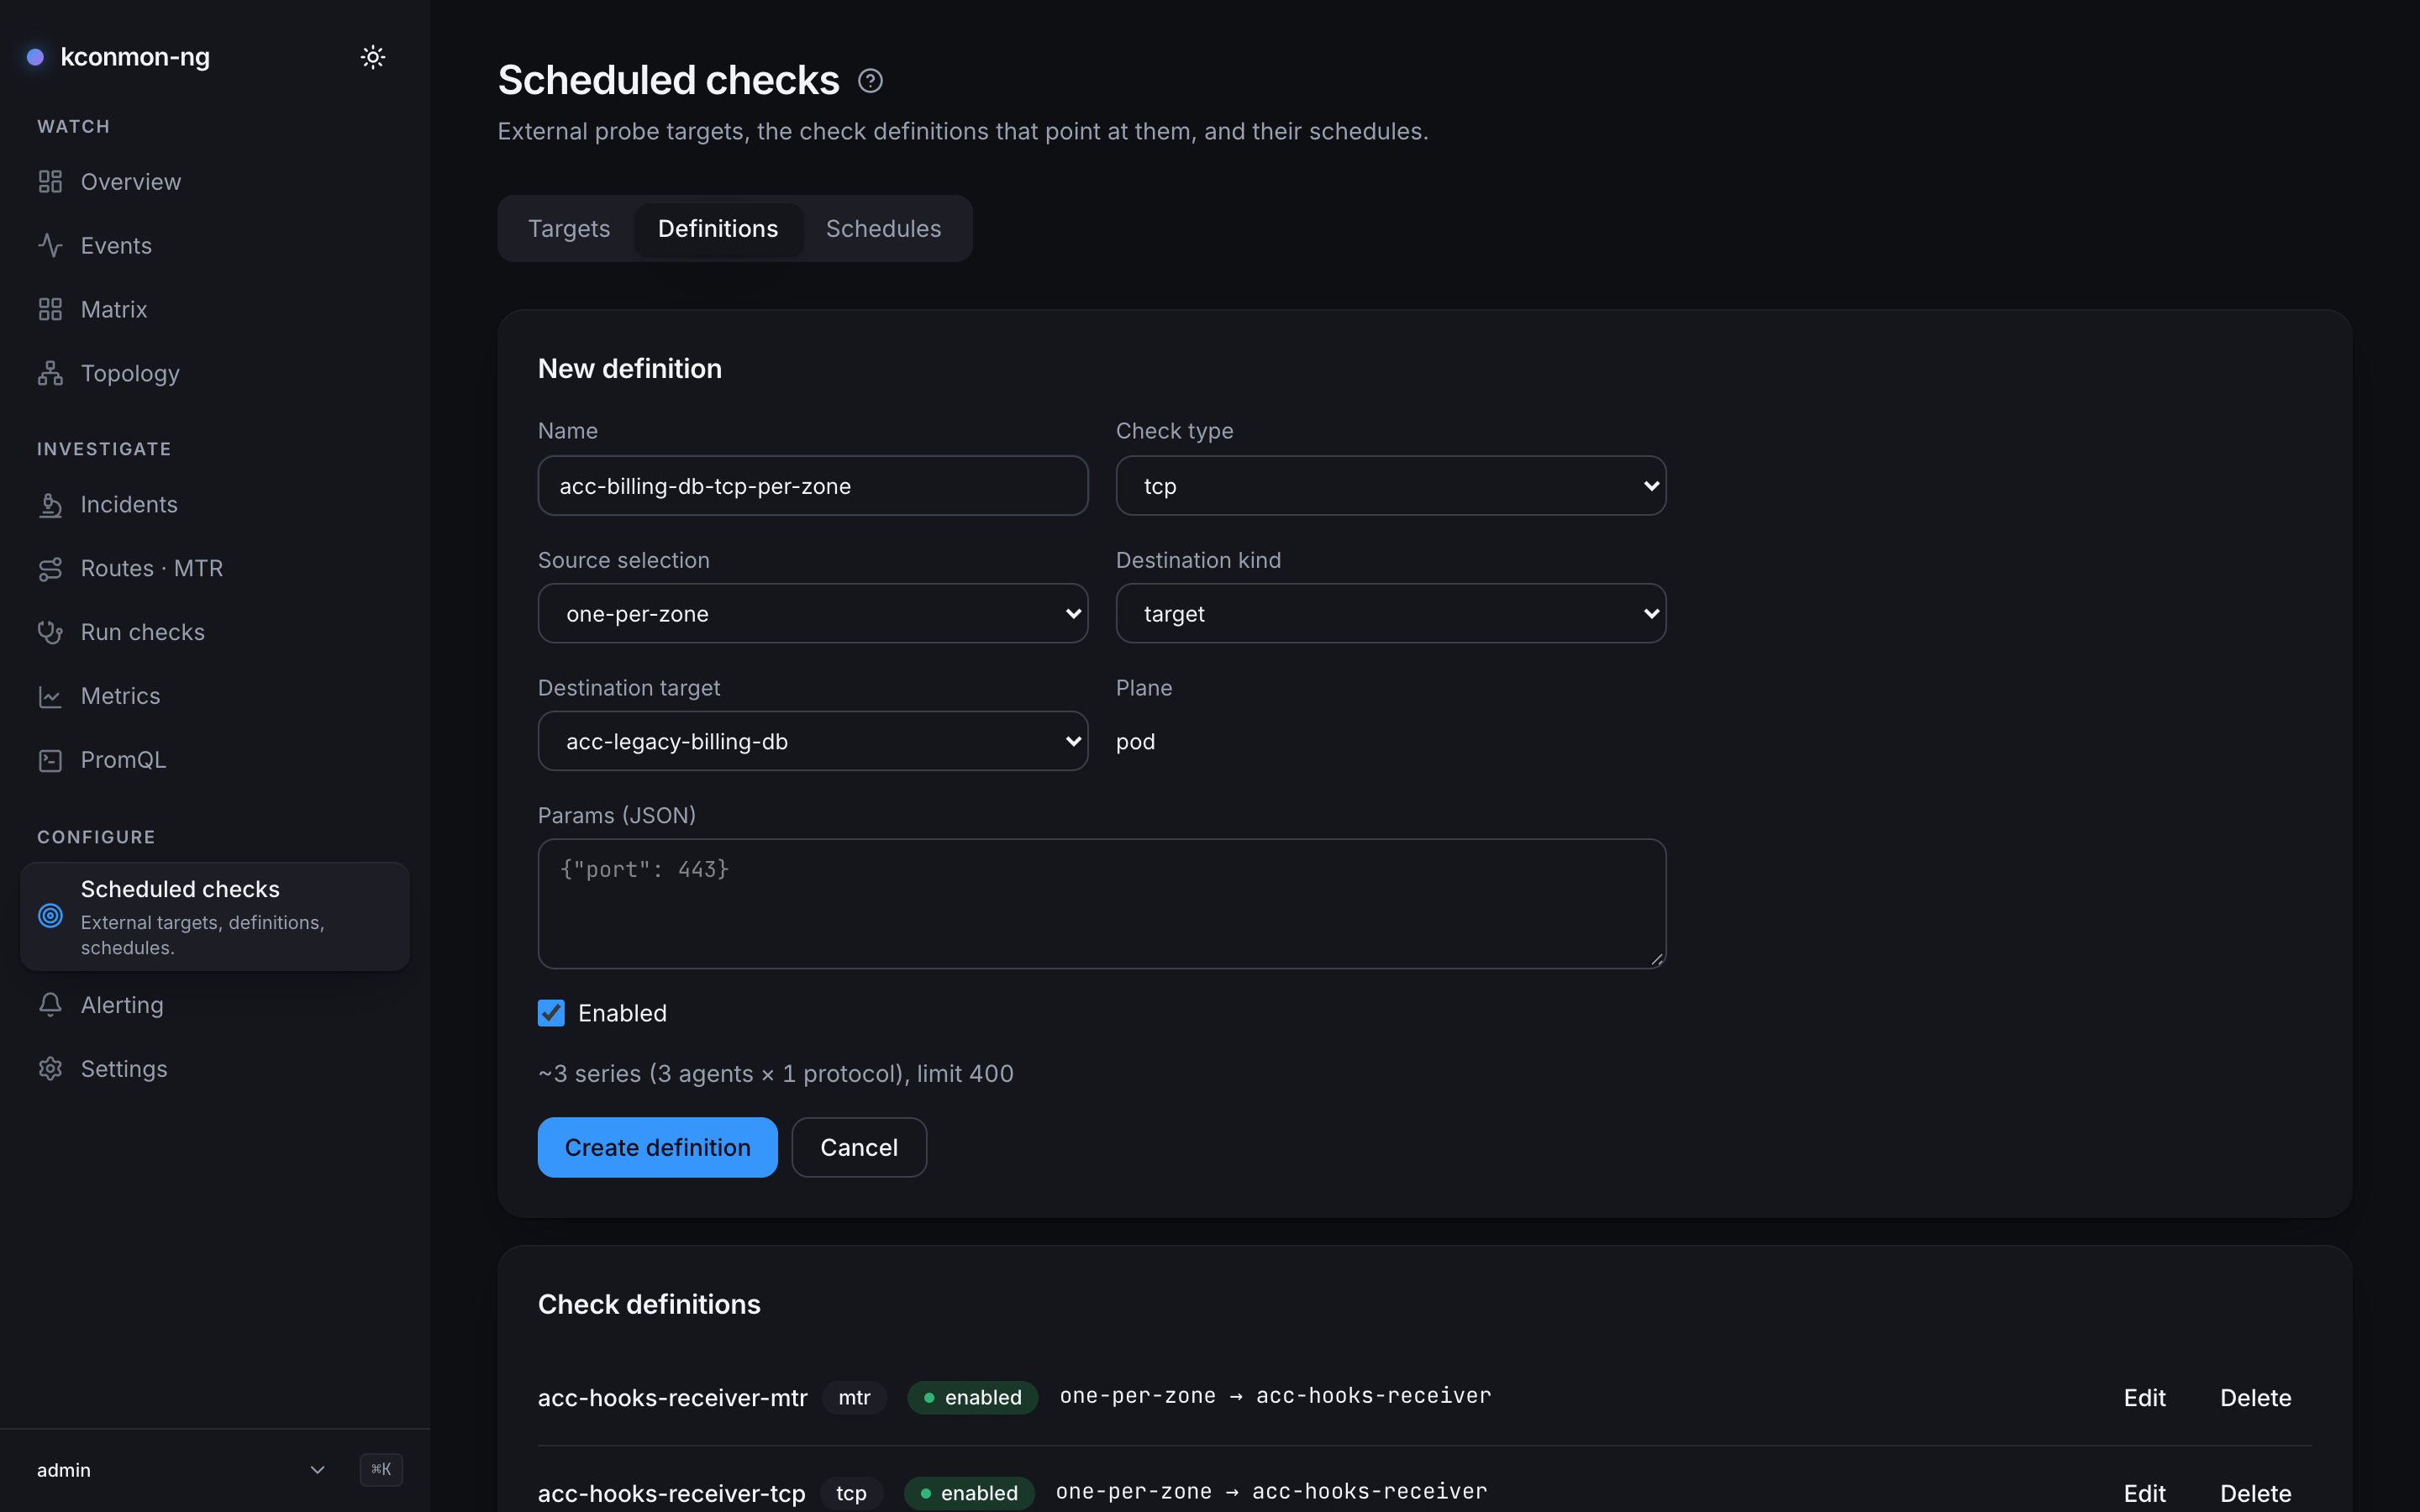
acc-legacy-billing-db target from one agent per zone, with the projected cost (~3 series from 3 agents) shown before the save.Continuous checks run at a fixed cadence: every 30s, with a 5s per-probe timeout. Both are constants the reconciler stamps onto every spec; there is no per-definition interval knob today. See Checks, runs and schedules for how the objects relate.
3. The dispatch loop. Continuous external checks are pushed to agents by the console's scheduler/reconciler, which is opt-in and needs a database:
A one-shot external probe needs none of layer 3: the Run checks page and the controller's diagnostics endpoint accept external destinations directly, still subject to layer 1.
Which check types can run continuously
tcp, icmp, dns and http. Not udp, and not mtr: the controller
rejects both on PUT /api/v1/external-checks, and the console's reconciler
filters such definitions out before the PUT so one ineligible definition
cannot fail the whole assignment. The reasons differ:
- UDP is a peer-to-peer protocol in this tool: the probe talks to the peer agent's own UDP echo server, and no external host runs one. There is nothing on the far side to answer.
- MTR run continuously against an internet destination is a traffic and
cardinality decision:
mtr_hop_rtt_secondsis labelled byhop_ip, unbounded for internet paths. A one-shot MTR to an external target still works through diagnostics.
Since 2.5.0 the console refuses both earlier: a udp definition toward a
target or ad-hoc destination at write time, and a continuous schedule of an
mtr one (a once or interval schedule of it still runs the one-shot
trace). A definition that slips through with either type (written before
2.5.0, or straight to the database) is skipped by the reconciler and counted in
kconmon_ng_console_external_specs_skipped_total{reason="check-type"}. That
metric, not an error page, is the observable symptom.
The controller takes at most 8 MiB of assignment in one PUT. When the enabled
continuous definitions would need more, the reconciler leaves whole
definitions out, newest first, logs a WARN once per definition and reason per
console process, and counts them as reason="over-budget", so a definition
added later never pushes out one already running. A 413 from the controller
itself still logs an ERROR.
The target cap
checkers.external.maxTargets (default 100) is enforced on the agent: an
assignment longer than the cap is truncated, the tail is not probed, and the
agent logs a WARN naming how many specs were dropped. Truncated targets also
lose their gauges, so a capped-out target reads as absent rather than as a
stale healthy reading. If a target you defined never reports, count your
definitions against the cap before debugging the network.
Verify probes
External metrics carry target (your name for it), target_kind and
check_type, and no destination_node, because the destination is not a peer:
# results flowing per target
sum by (target, check_type, result) (rate(kconmon_ng_external_results_total[5m]))

# probes REFUSED before they happened, by reason
sum by (target, reason) (rate(kconmon_ng_external_denied_total[5m]))
If a probe never happens, kconmon_ng_external_denied_total holds the
answer; the denial reasons (cidr / resolve / disabled) and why a denied
probe is a visible zero rather than a failure rate are documented in the
metrics reference.
Alert on external failures
The bundled ExternalChecksFailing rule (prometheusRule.enabled) fires
when a target's failure ratio exceeds 10% for 5 minutes, looser than the
in-cluster 5% on purpose, because external paths cross networks you do not
run. Its annotation names the source node, the target and the measured
percentage. Tune it like every built-in:
The ratio rule cannot see a probe that never runs, so pair it with a denial
alert of your own (via prometheusRule.additionalRules or the
Console rule editor) on
rate(kconmon_ng_external_denied_total[5m]) > 0. That is the alert that
catches an allowlist typo or a NetworkPolicy that quietly ate your probes.