Catch a breakage
Fifteen more minutes: break one protocol on one node pair, on a disposable cluster, and watch the Console isolate it. This page keeps to the short, console-only path. The full demo, Breaking the network on purpose, runs the same break with PromQL proof at every step, reads the MTR trace, breaks three more protocols at once, and wires an alert rule and a webhook to the failure; go there for the complete script.
Stand up the disposable cluster
Know what that command does to your machine before running it. It starts a
3-node Minikube cluster (profile kconmon-test) on the Docker driver, each
node sized at 2 CPUs and 4 GB of memory, then builds the three images locally
and loads them into Minikube. The console image is by far the slowest, since
it builds the SPA in a Node stage first, so expect the first up to take a
while. It installs kube-prometheus-stack into monitoring, applies a
throwaway single-Pod PostgreSQL and a generated webhook-key Secret, installs
kconmon-ng (Console included, anonymous auth with the admin role) into
default, runs smoke tests, imports the Grafana dashboards and prints access
URLs. The script wants minikube, docker, helm, kubectl, openssl,
python3, curl and lsof on the PATH, and refuses to start without them.
make local-up runs the same script, and ./hack/local-test.sh down deletes
the whole cluster afterwards.
Reach the Console:
Break one pair
We will blackhole only UDP from node m02 to node m03. TCP, ICMP and
every other pair stay untouched, which is the realistic shape of a production
failure: one direction dead on one protocol while the HTTP health checks stay
green. The path MTU probe (since 2.5.0) sends its datagrams to the same UDP
echo port, so with nothing crossing it has no MTU verdict to give, and this
pair's PMTU cell reads no data once its last verdict leaves the 5-minute
window.
Agents probe each other pod-IP to pod-IP, and each protocol has its own rendezvous port: UDP probes target the agent's gRPC/probe port 9090 (that is where the agent's UDP echo listens), while TCP probes dial the agent's HTTP port 8080. Keep that in mind when you later switch protocols in this experiment: block the wrong port and the rule silently matches zero packets. The rendezvous table lists all three.
Find the agent pod IPs first:
The drop rule goes on m03, and on its FORWARD chain, for a reason worth one
sentence: cross-node pod traffic is routed rather than locally delivered, so
it transits FORWARD on the node hosting the destination pod. An OUTPUT rule
on the source node would match nothing, because OUTPUT only sees traffic the
node's own network stack originates and pod traffic arrives over a veth.
Substitute the two pod IPs from your own listing: the source agent's on
m02 and the destination agent's on m03:
minikube -p kconmon-test ssh -n kconmon-test-m03 -- \
  'sudo iptables -I FORWARD 1 -p udp -s 10.244.1.10 -d 10.244.2.15 --dport 9090 \
   -j DROP -m comment --comment "kconmon-demo-udp-blackhole"'
To confirm the rule is actually eating packets, check its iptables counters; the demo page shows the exact command and the counter values to expect.
Watch it surface in the console
Open Matrix, protocol UDP. The delay before the cell turns has real
arithmetic behind it: the UDP checker fires every 5 s, so within at most one
interval a probe fails and the agent publishes loss 1.0; Prometheus then
picks it up on its next scrape (this stand scrapes every 10 s, set by
serviceMonitor.interval in hack/values-local.yaml; the chart default is
15 s). Around 15–20 seconds after the break, five cells stay green and the
m02 → m03 cell turns red. The frame below is the same exercise at a larger
scale on the stand the screenshots were taken on, with UDP dropped on its way
into the three zone-b nodes, worker3, worker4 and worker5:
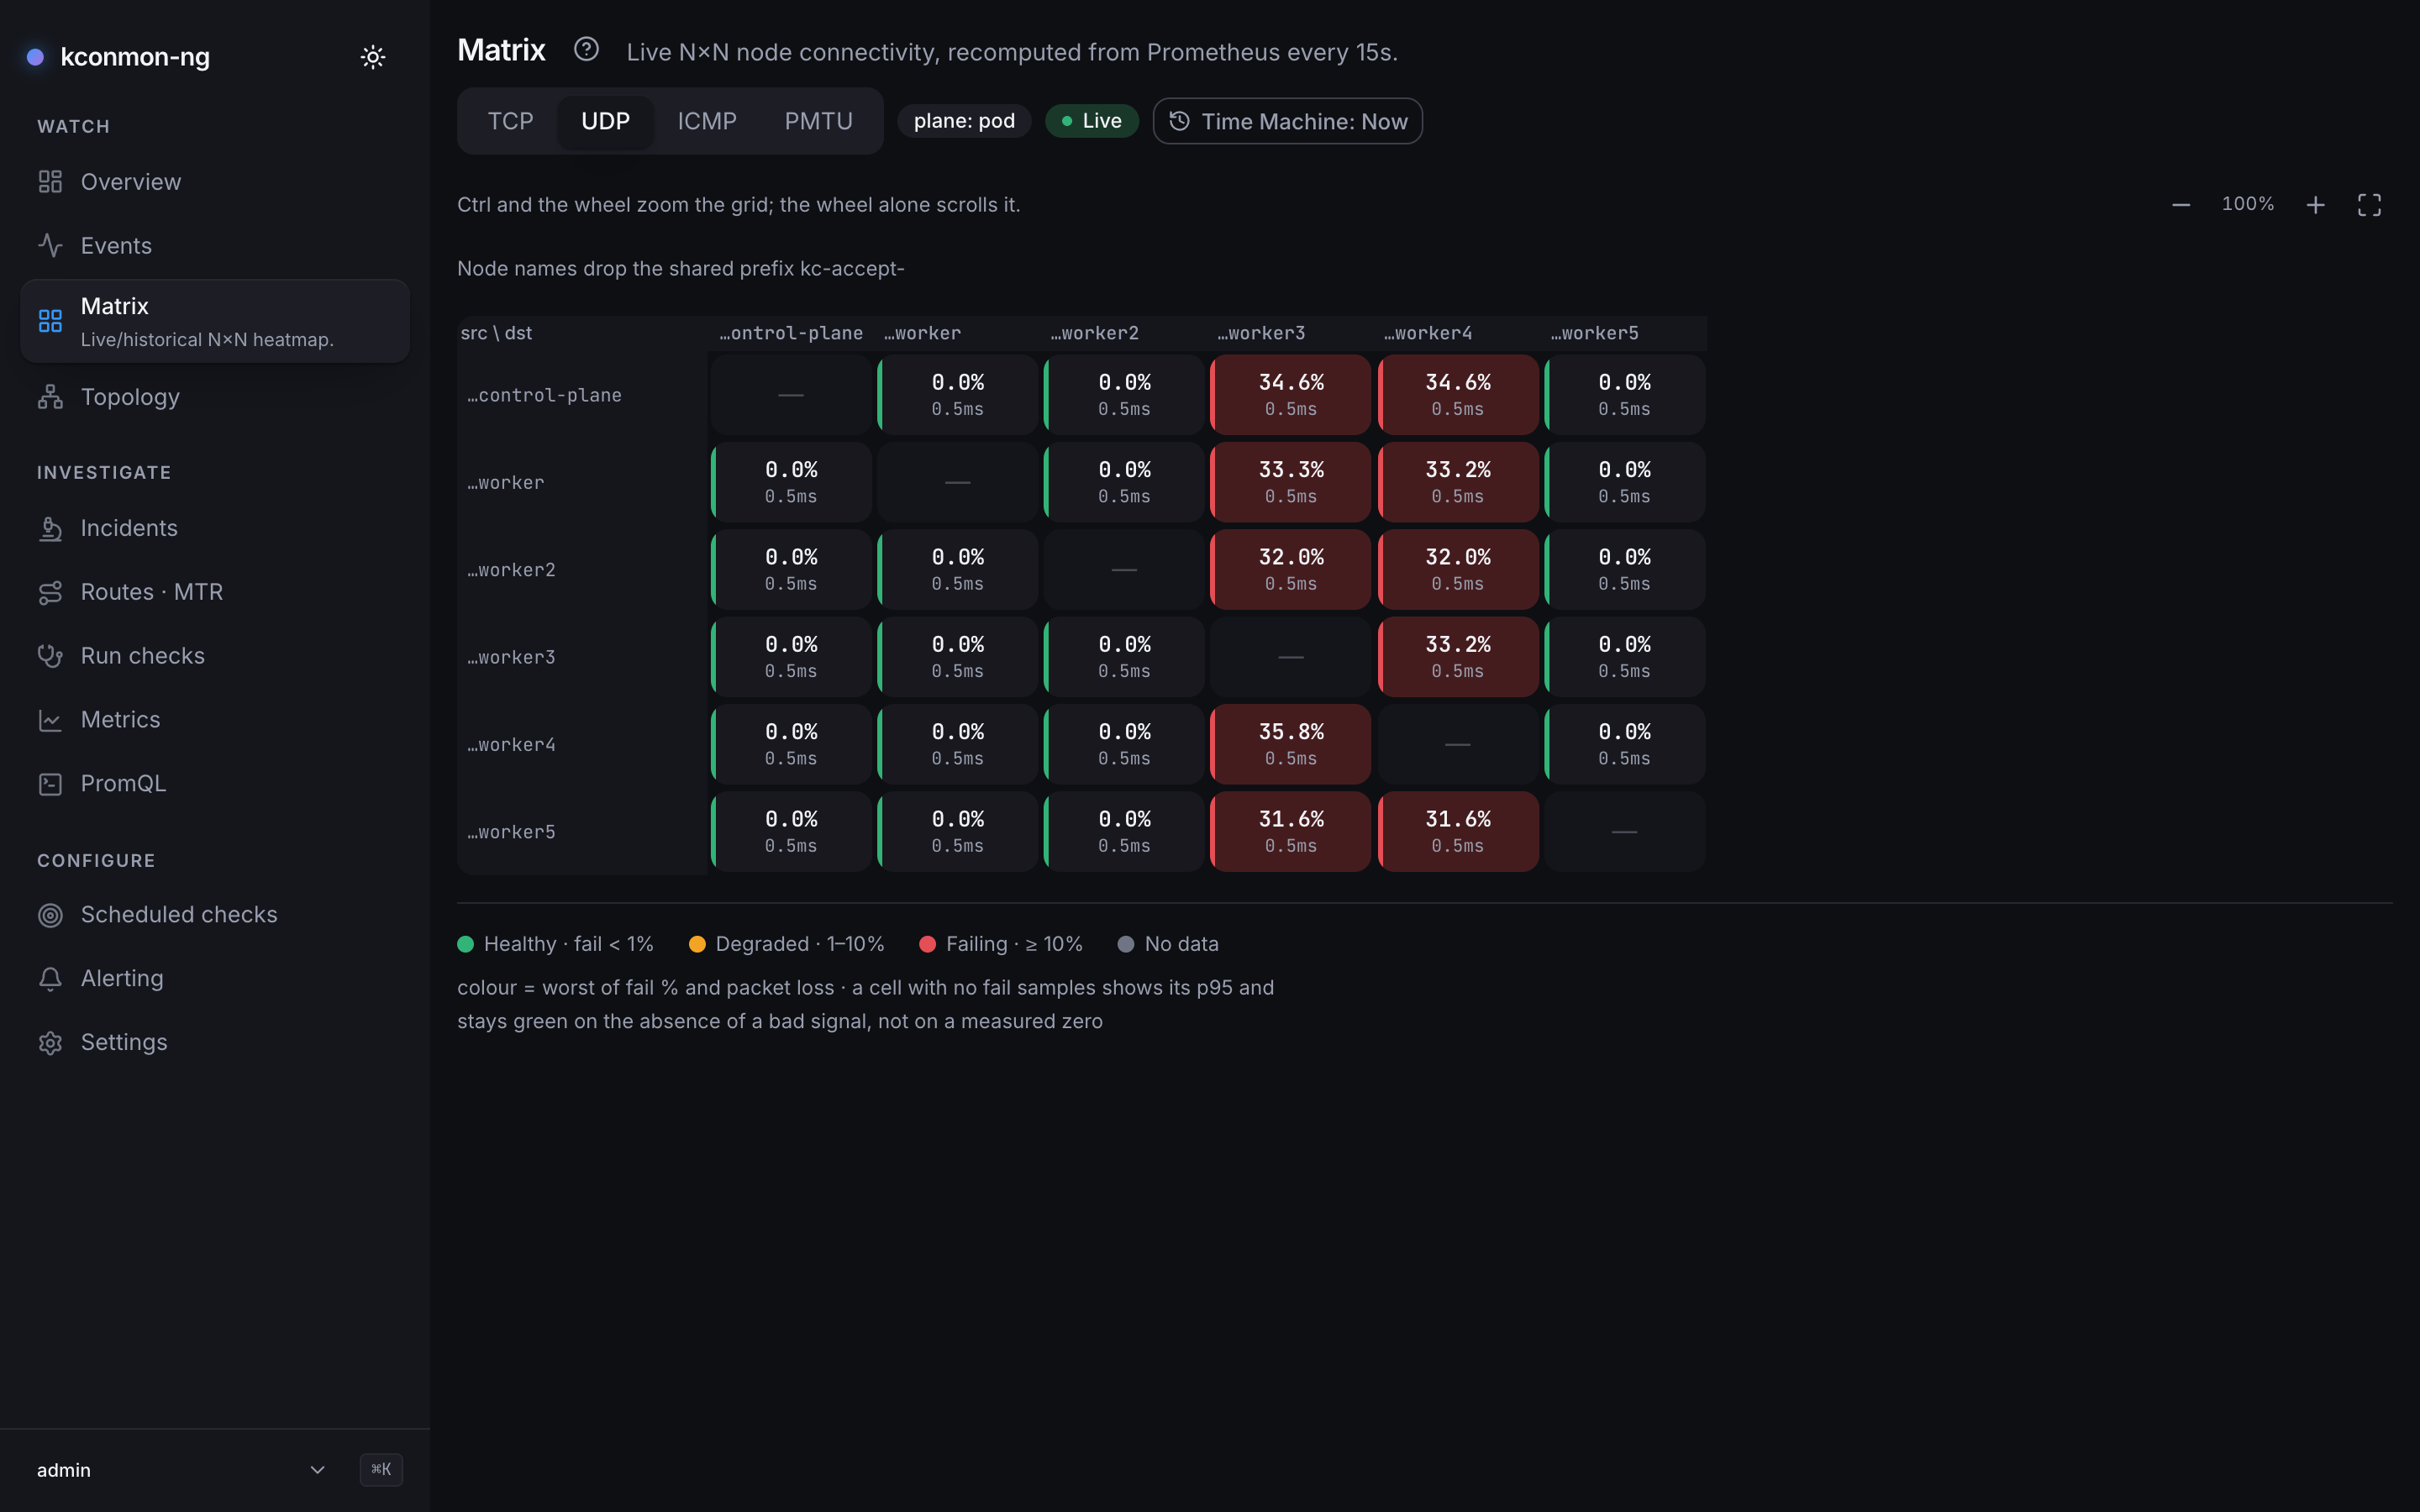
Now flip the protocol selector to TCP or ICMP: the same cell is green. That switch is the point of the exercise: the Console has isolated a single protocol on a single ordered pair, which no "can A reach B" check would ever tell you.
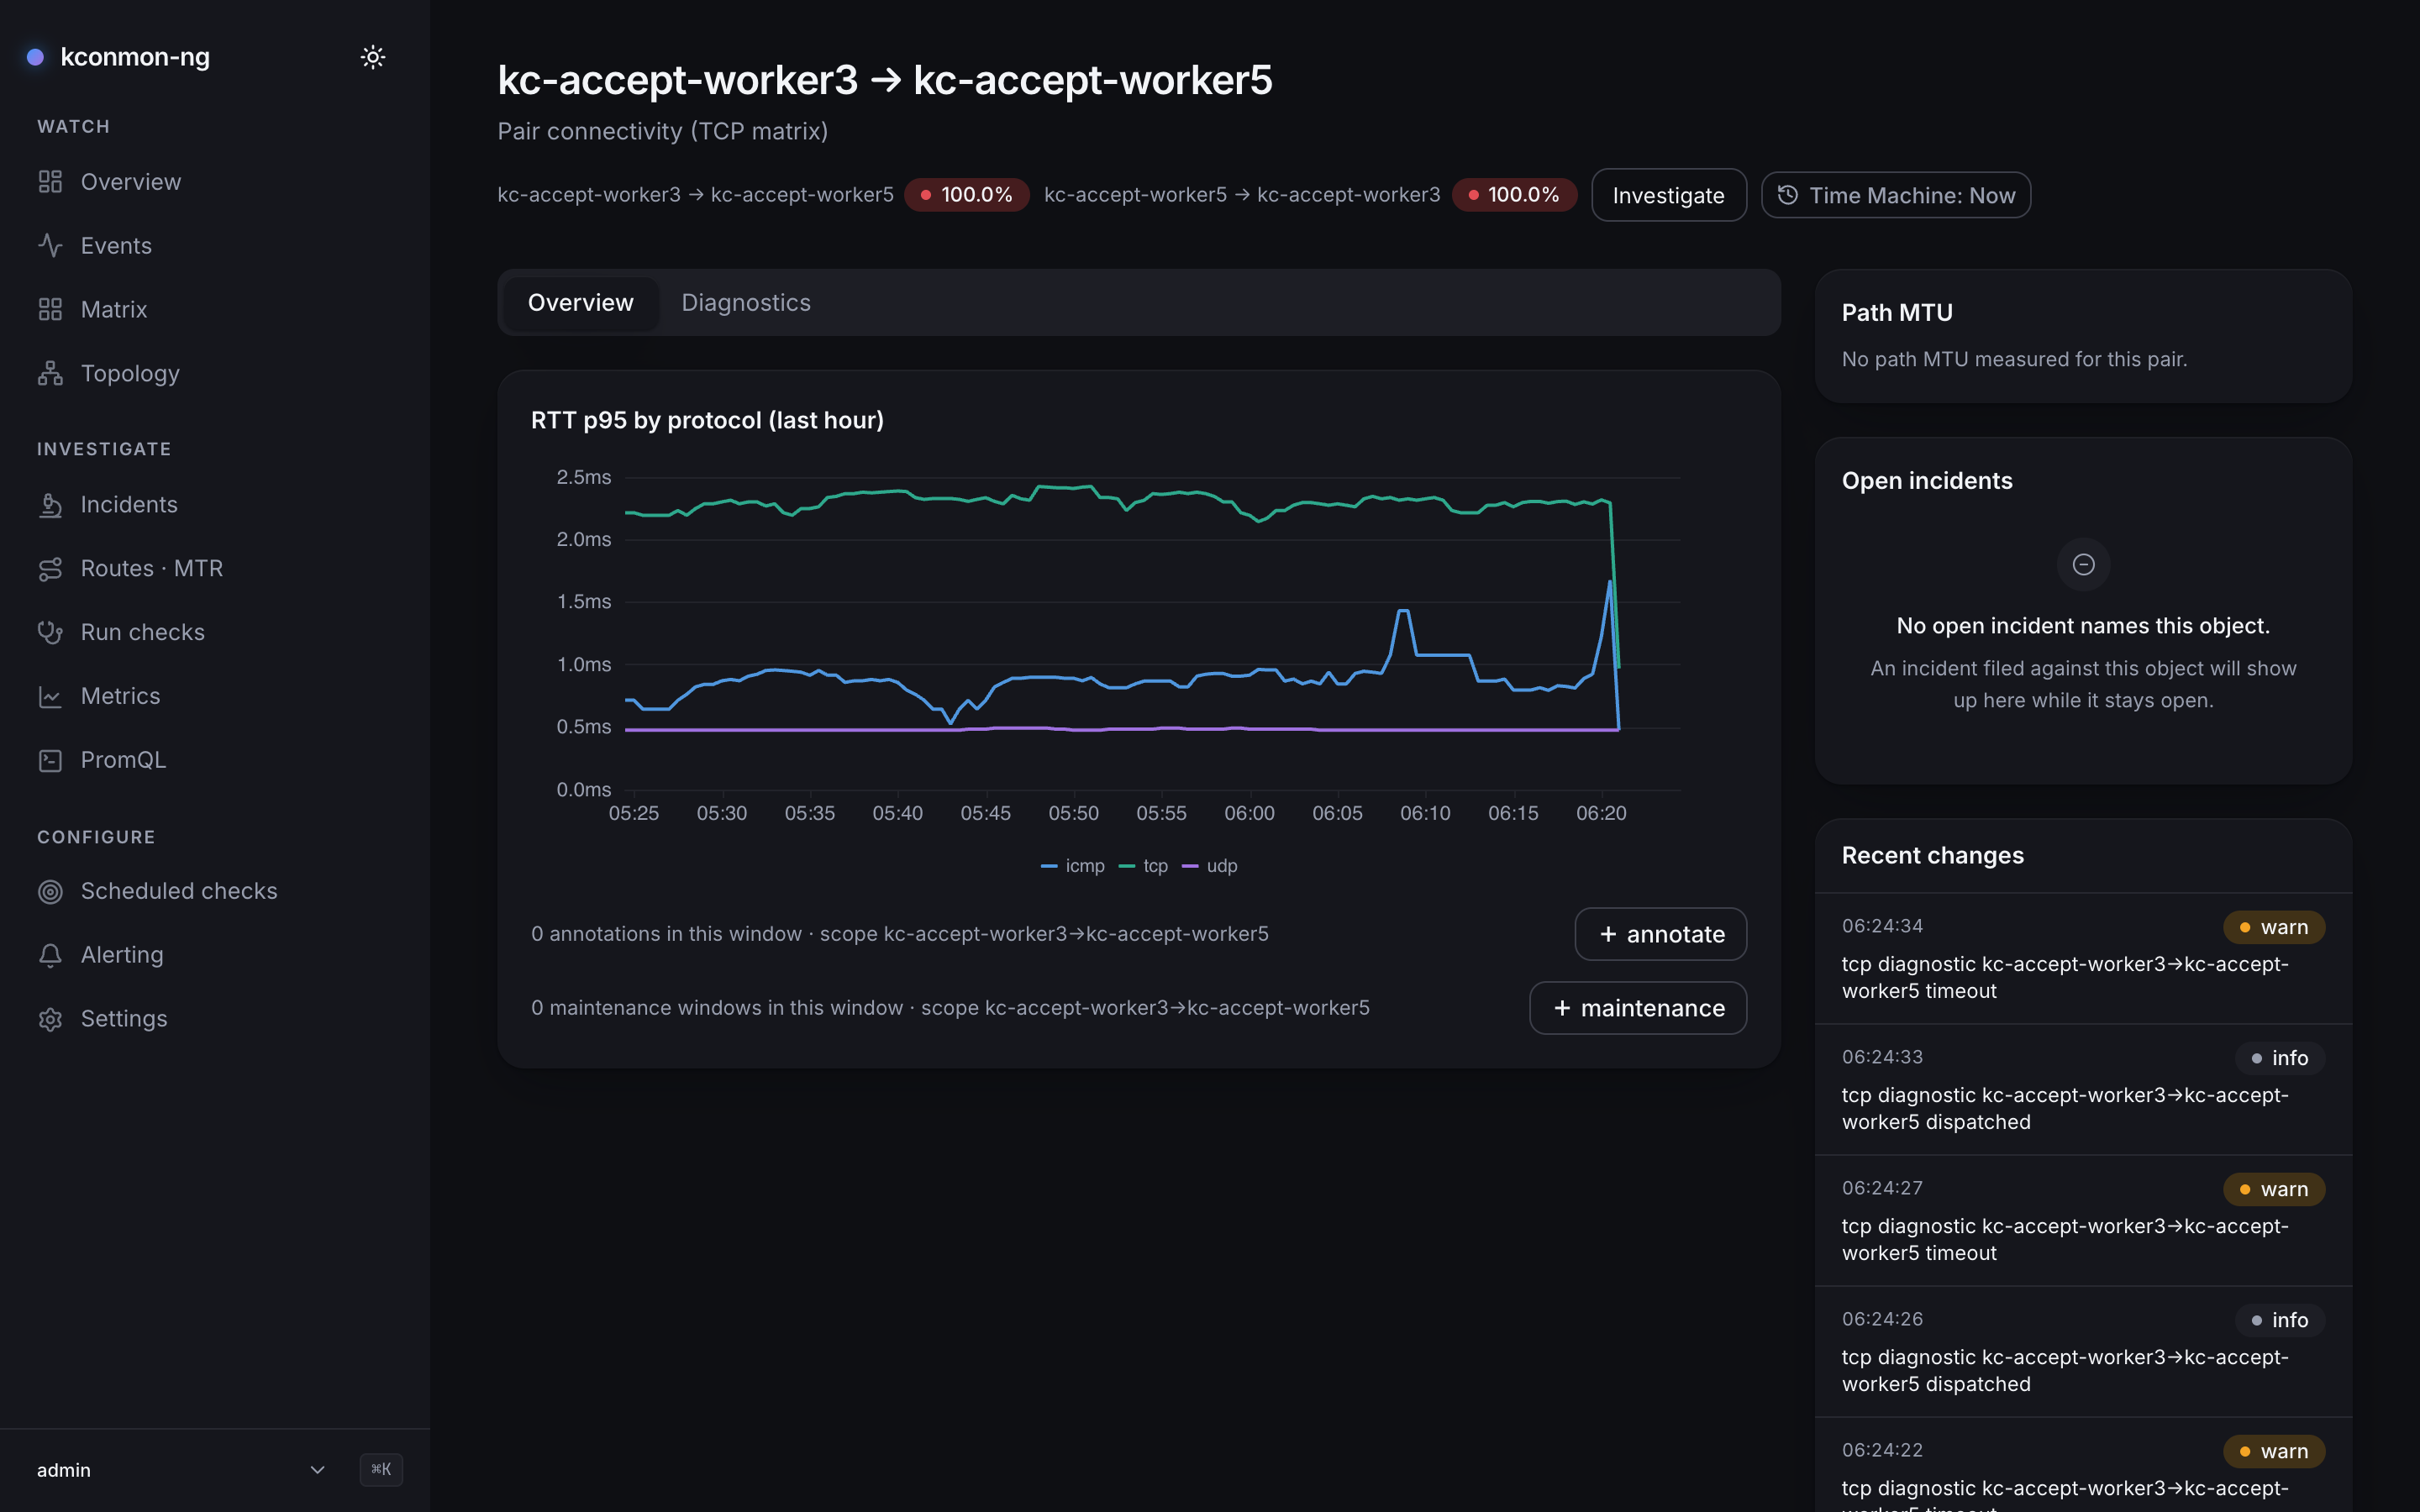
Clicking the red cell opens the pair card: the pair's loss and RTT
charts, its recent MTR path history, and a rail of the topology and
diagnostic events around it. You never asked for a trace; a failed probe
auto-triggers MTR for the pair, and the demo page walks
reading that trace hop by hop. The bundled
UDPLossHigh alert goes pending within about half a minute and fires
after its 5-minute hold.
The pair page below was shot during a different, larger break on the same
stand, with zone-c (worker6 and worker7) blackholed on TCP, UDP and ICMP.
That is why worker3 → worker6 fails on TCP and in both directions, which
the UDP drop into zone-b above would never produce:
Prefer proof in PromQL over pictures? The demo's baseline and verification queries cover the same minute series by series.
Clean up
Remove the rule. The next successful probe overwrites the loss gauge within one probe interval plus one scrape, but the cell is coloured by the worse of loss and failure ratio, and the failure ratio is a 5-minute window: the cell drains through amber and is green again about five minutes after the revert.
minikube -p kconmon-test ssh -n kconmon-test-m03 -- \
  'sudo iptables -D FORWARD -p udp -s 10.244.1.10 -d 10.244.2.15 --dport 9090 \
   -j DROP -m comment --comment "kconmon-demo-udp-blackhole"'
A leftover DROP rule quietly breaks your next run, so audit all three nodes before tearing down; the demo's cleanup section has a loop that checks every node in one go. Then:
Keep going: the full demo blackholes UDP on a single pair, correlates it on the Incidents page, declares an alert rule scoped to that pair and points a signed webhook at it, then cuts off a whole zone and two more nodes at once on TCP, UDP and ICMP.